
|
In this unit we will learn all about weather and climate! Who measures the weather? What instrument is used to measure how fast the wind moves? Why do we get stuck in traffic after it rains? Ever heard of hurricanes or heatwaves? We're going to see how they affect the people and landscape. Weather is one of the most interesting topics to learn, so let's start!
The lessons covered in this unit are: 1. Weather and climate 2. Weather elements 3. Weather instruments 4. The Stevenson screen 5. Temperature and precipitation graphs 6. The weather report 7. Too much rain 8. Heatwaves and drought 9. Strong winds |
1. WEATHER AND CLIMATE
|
🡺 I can differentiate between climate and weather.
Weather means the condition of the air around us at a particular time. It might be sunny, hot, windy or cloudy, raining or snowing. These conditions change from hour to hour and from place to place. It may be sunny in one part of the country but raining a few kilometres away. A place may experience a sudden change in the weather at any time. In one day, it may be sunny, rainy, windy, warm or cold. Climate is about weather patterns over a long period of time, usually 30 years. It tells us what weather is likely in any period of time in any place. Climate refers to what is expected to happen in the atmosphere rather than the actual conditions. It is possible for the weather to be different from that suggested by the climate. |
|
Geo-check!

1. Make a mind map for all the types of weather you can think of.
2. Write down whether these statements are talking about climate or weather. [REMEMBER: Weather is over a short period of time and climate is over a long period of time.]
a. Everybody agreed that the day was just right for a picnic and swim. What a bright, sunny morning!
b. Antarctica has been freezing cold, even in summertime, for tens of thousands of years.
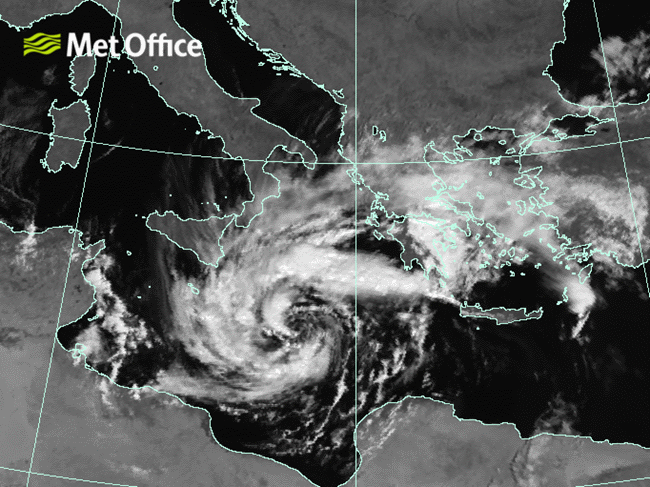
c. A heatwave warning is being issued in Sicily.
d.“Every winter there was so much snow. When I was a young boy it piled up to our waists,” said the old man.
e. England has cool summers and wet winters.
f. It rained much more in August this year, when compared to last year.
3. Look at the cartoon here. Write down which man is talking about weather and which one is talking about climate.
4. Explain why you chose the answers in question (3).
2. Write down whether these statements are talking about climate or weather. [REMEMBER: Weather is over a short period of time and climate is over a long period of time.]
a. Everybody agreed that the day was just right for a picnic and swim. What a bright, sunny morning!
b. Antarctica has been freezing cold, even in summertime, for tens of thousands of years.
c. A heatwave warning is being issued in Sicily.
d.“Every winter there was so much snow. When I was a young boy it piled up to our waists,” said the old man.
e. England has cool summers and wet winters.
f. It rained much more in August this year, when compared to last year.
3. Look at the cartoon here. Write down which man is talking about weather and which one is talking about climate.
4. Explain why you chose the answers in question (3).
2. WEATHER ELEMENTS
|
🡺 I can define the elements of the weather namely temperature, rainfall, wind direction and speed.
Meteorologists measure weather by recording these weather elements. We will be learning about some of them in more detail.
Temperature Temperature is the amount of heat in the air. Temperature varies in different areas of the same country and also in different countries. Certain places are always warmer than others and other places are always colder. When we talk about temperature, we use the following words:
Precipitation All liquid and solid water particles that fall from clouds and reach the ground. These particles include drizzle, rain, snow, ice, mist, fog and hail. Wind Wind is the result of differences in the air pressure. It can be measured for both force or speed and direction.
|
|


Geo-check!
|
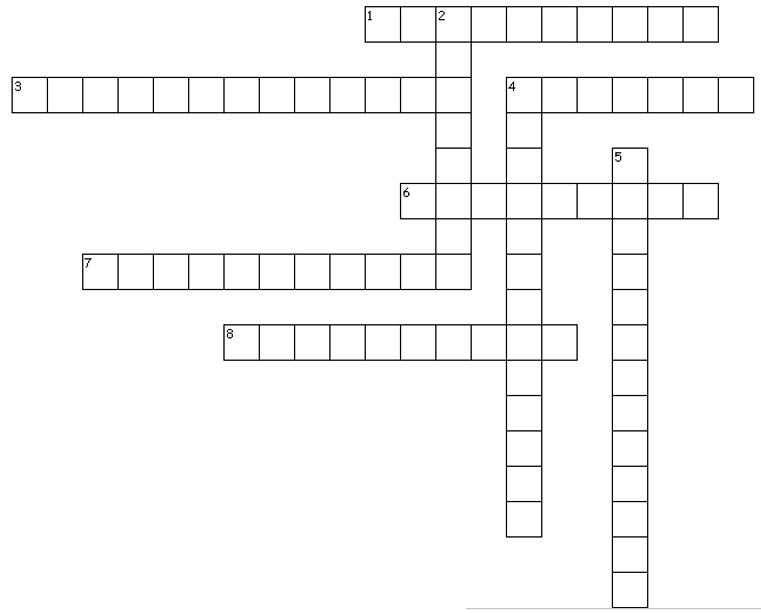
1. Use the clues about the seven weather elements written to fill in this crossword.
Down 2. ___________ is measured by a sunshine recorder. (8) 4. ___________ is where the wind blows from. (4,9) 5. ___________ is someone who studies the weather. (13) Across 1. ___________ is how far we can see. (10) 3. ___________ is rain, snow, hail or sleet. (13) 4. ___________ is the condition of the air around us at a particular time. (7) 6. ___________ is measured in kilometres per hour. (4,5) 7. ___________ is how hot or cold it is. (11) 8. ___________ is measured in eights. (5,5) 2. Below is a weather report taken in Malta. DAY 1 Maximum temperature: 28°C Minimum temperature: 21°C Rainfall in past 24 hours: 2 mm Hours of sunshine: 11 hours a. Do you think Day 1 is in winter or summer? Why? b. Fill in the numbers of the weather report for the other season here: DAY 2 Maximum temperature: 28°C Minimum temperature: 21°C Rainfall in past 24 hours: 2 mm Hours of sunshine: 11 hours |
|
3. WEATHER INSTRUMENTS
|
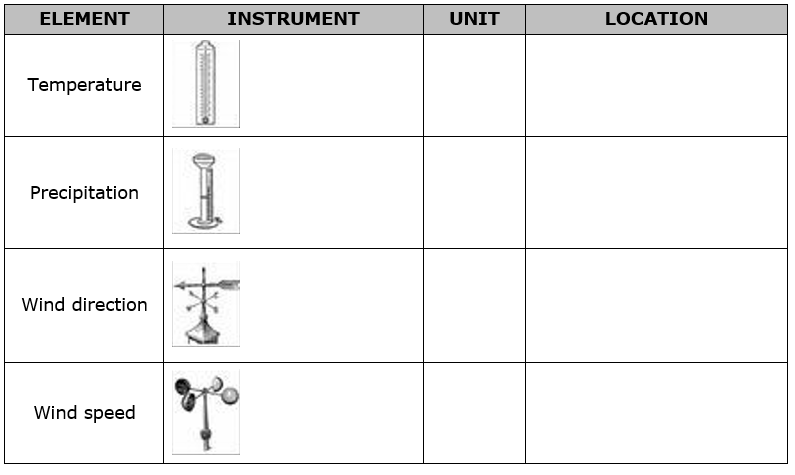
🡺 I can describe the following weather instruments and identify the best location for each of them: anemometer, wind vane, rain gauge, maximum and minimum thermometers.
At a meteorological station, there are various instruments that help meteorologists understand the weather better. They measure weather conditions in different places and use this information to report and make forecasts about future weather conditions. The weather instruments measure the various aspects of the weather. Temperature Temperature is measured in Celsius (°C) using a minimum and maximum thermometer. The maximum thermometer records the highest temperature reached during the day and the minimum thermometer records the lowest temperature reached during the night. It must be shaded from direct sunlight and should have air circulating around it. Precipitation Precipitation is measured using a rain gauge. This is a funnel inside a graduated container. The depth of the rain in millimetres can be read from the side of the container. Wind direction Wind direction is reported by the direction it is blowing from. It is measured using a wind vane. Wind speed Wind speed can be measured using an anemometer. The strength of the wind is measured on the Beaufort scale. |
|


Geo-check!
|
1. The wind vane and anemometer need to be kept high above the ground. Why do you think this is?
2. Fill in the table here. 3. If you had to go on a new planet and only had space for TWO weather instruments, which ones would you take? Why? --->>> CHALLENGE! Match the phrases at the top with the ones at the bottom:
____ and sea measure wind, rainfall, temperature and more. ____ measure winds, temperature and humidity in the sky. ____ report as they travel the world. ____ show where it is raining. ____ in space send back photos of clouds. |
|
4. THE STEVENSON SCREEN
|
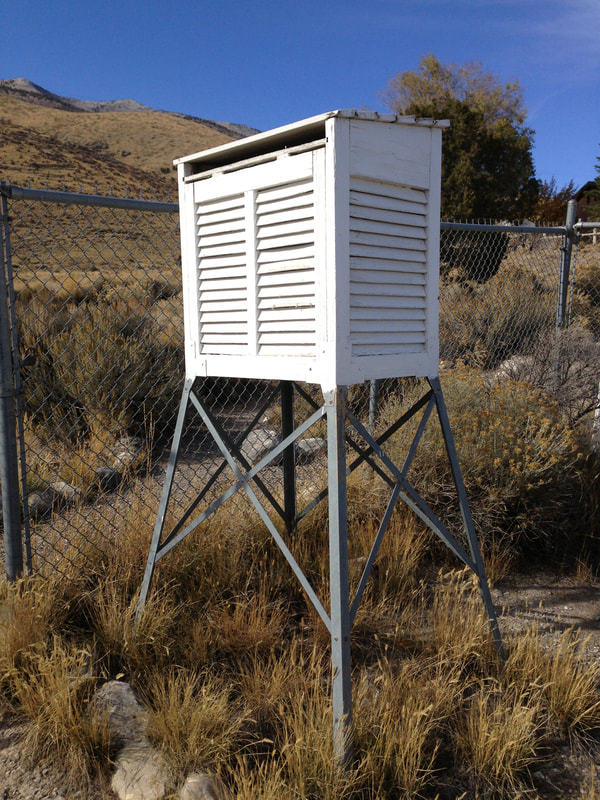
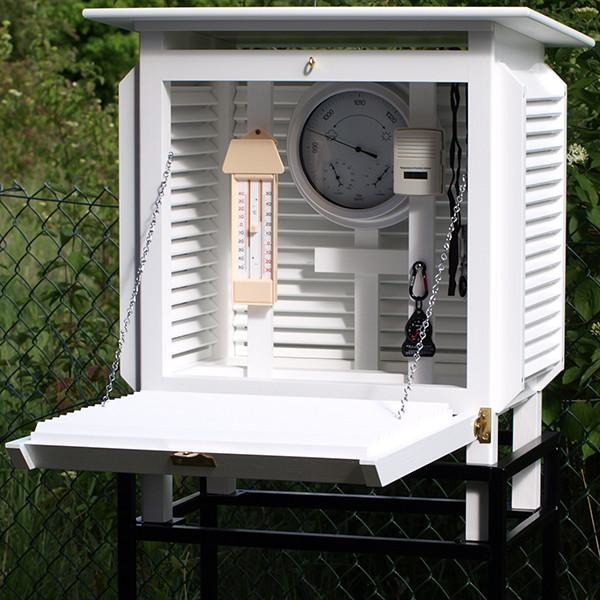
🡺 I can explain the use and characteristics of the Stevenson Screen to provide accurate temperature readings.
The Stevenson Screen is a wooden box that shelters meteorological instruments. The minimum and maximum thermometer and the instruments that measure humidity and air pressure are all kept in here. It is important that it is:
|
|
Geo-check!
1. What might happen if the thermometer is placed near the ground?
2. What might happen if the thermometer is not placed inside the Stevenson screen?
2. What might happen if the thermometer is not placed inside the Stevenson screen?
5. TEMPERATURE AND PRECIPITATION GRAPHS
|
🡺 I can plot and read separate temperature and precipitation graphs from data presented.
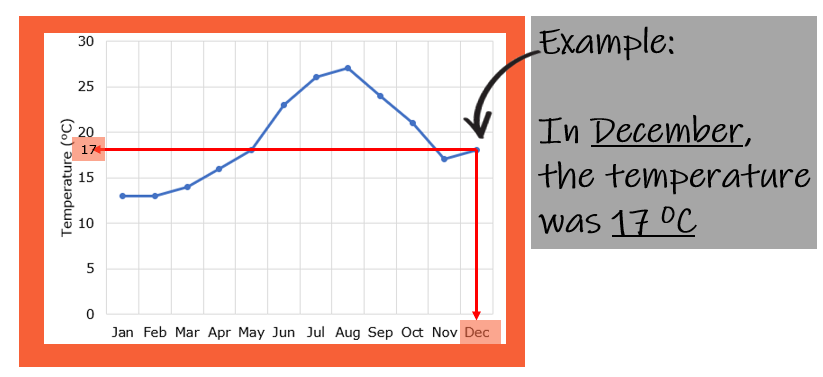
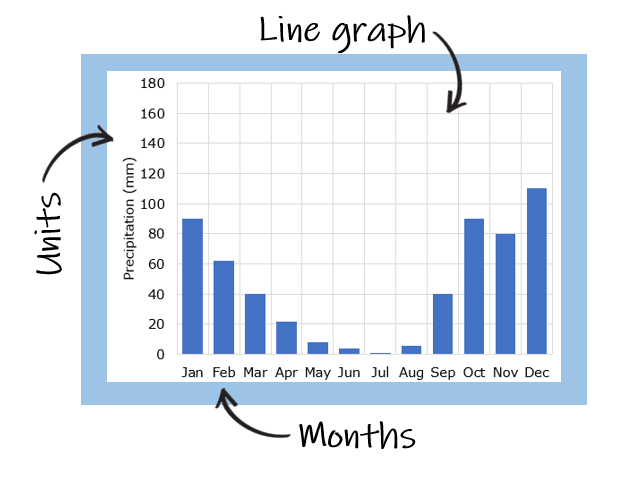
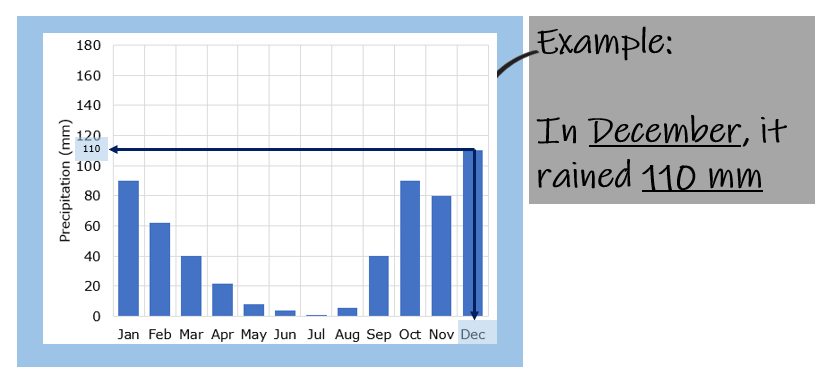
Temperature and precipitation graphs can help us know what to expect the climate to be like. They usually show the rainfall or temperature throughout one whole year. Temperature graphs are usually line graphs, while precipitation graphs are usually seen as bar graphs. When looking at a temperature or precipitation graph it is important to look at patterns in the data to help you describe the climate. On the right you can see how to read the graph. |

|
|
Geo-check!
|
1. Graph 1 shows the mean monthly temperature for Malta taken over 40 years. Analyse it and answer the questions below.
a. Which month has the highest mean temperature? b. Which months have the lowest mean temperatures? c. What is the temperature in April? d. Which two months have the same mean temperature? What temperature is it? e. What is the annual range in temperature in Malta? 2. Graph 2 showing the mean monthly temperature for Malta taken over 40 years. Analyse it and answer the questions below. a. The following data has been left out of the graph. Draw four bars to complete the precipitation graph.
b. Which month had the highest mean rainfall? c. How many mm of rain was recorded during this month? d. Which month has the lowest mean rainfall? e. How many mm of rain was recorded during this month? f. Were there any months without rain? g. How would you calculate the mean yearly rainfall? Look at these 6 graphs below showing temperature and precipitation for three well-known cities. 3. Study the top three graphs. They show the annual temperature for Luqa in Malta, London in the UK and Perth in Australia. a. Which city has the highest temperature? b. Which city has the lowest temperature? c. What pattern do you notice with the temperatures in both Luqa and London? d. What is different about the temperatures in Luqa and London? e. Describe the temperature in Perth throughout the year. (Use at least 10 words) 4. The bottom three graphs on the previous page show the annual precipitation for Luqa, London and Perth. a. Write down the amount of precipitation, for all three cities, in the month of June. b. What do you notice about the precipitation in London? c. What do you notice about the precipitation in Malta? d. What do you notice about the precipitation in Perth? 5. Which city would you prefer to live in? Give reasons for your answer. [Don’t forget to mention both temperature and precipitation.] |
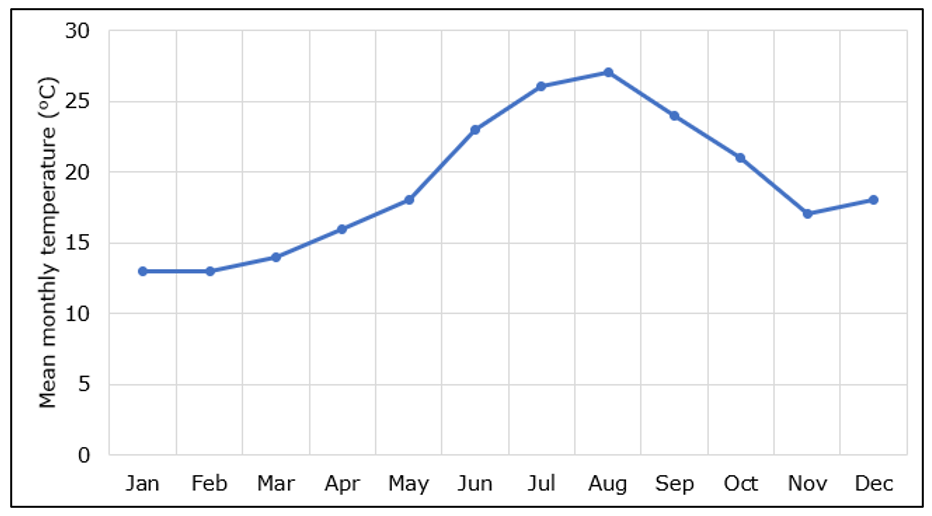
Graph 1 - Mean Temperature
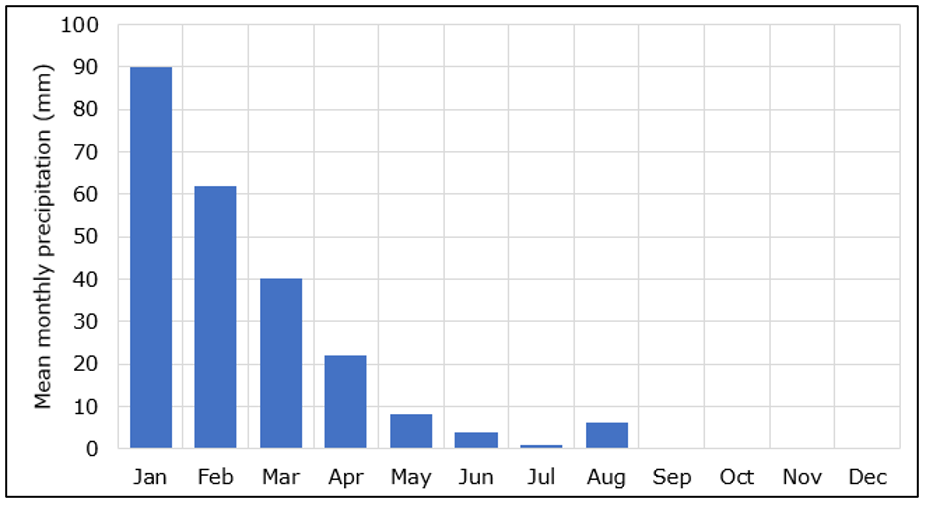
Graph 2 - Mean Precipitation

Temperature and precipitation graphs fro Luqa, London and Perth.
|
6. THE WEATHER REPORT
|
🡺 I can use the internet to find out the weather report and forecast of local and foreign places.
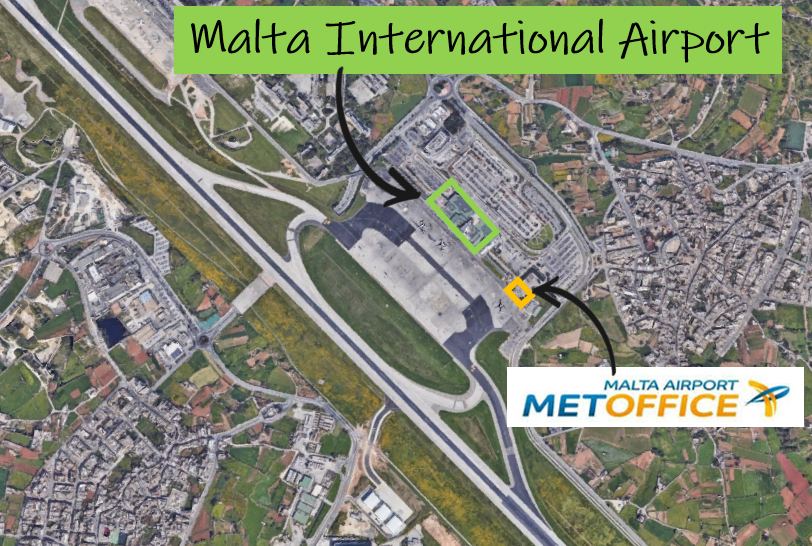
The weather can control many human activities. Weather affects us in many ways. It affects what we do and what we wear, how we travel and even our moods. Due to this, humans have started observing and recording the weather. Meteorologists measure weather conditions in different places and use this information to make weather reports and forecasts. A weather report can only be given for a past period and gives the actual weather conditions that have already occurred. A weather forecast is given before the date and gives an indication of what weather conditions could be expected. Weather forecasts can be made from a few days to two weeks in advance. In Malta, the MetOffice is found in Gudja near the airport. This MetOffice collects and records weather information and shares it with other countries around the world. Meteorological stations in the same area also share weather conditions with nearby countries. |
|

Geo-check!
|
1. Why do you think the Met Office in Malta is located near the airport?
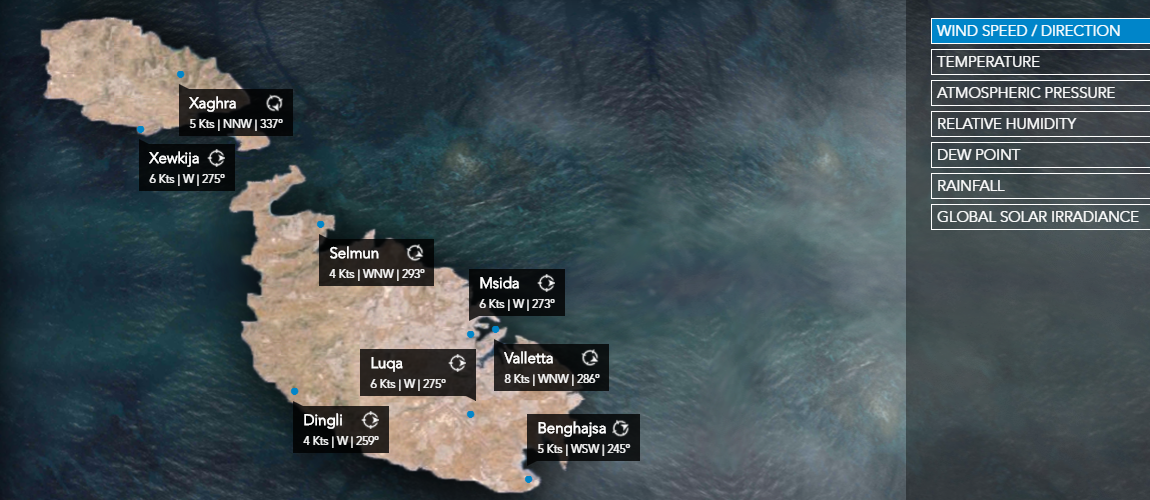
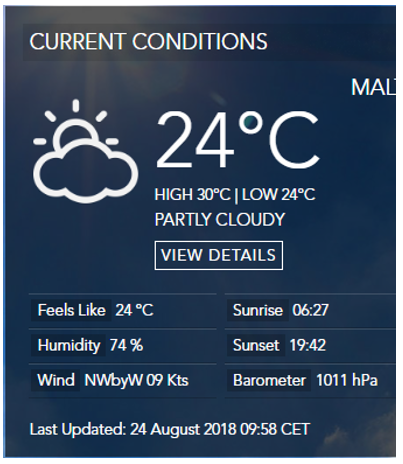
2. Why do meteorologists need many sources of information about the weather to create an accurate weather forecast? 3. This image showing 'Current conditions' is taken from the Malta MetOffice website. a. What day does this weather report show? b. What were the highest and lowest temperatures on this day? c. Which direction was the wind coming from? d. What other information does this report give us? 4. Study the 7 day forecast below. a. What days is this weather forecast showing? b. Which day is foretasted to have the highest temperature? c. What is the temperature on that day? d. Which day will be best for a picnic? Explain your answer. e. Which day would be the worst one for swimming? Explain your answer. 5. Think of a city you would like to visit. Look up and record the weather for a week in a graph like the one on the right. (There are two links on the right to help) Write down the following: City ______________ Country ______________ Continent ______________ When you finish writing down the weekly weather answer the following questions: a. Did you expect the weather to be like this? b. What was the most common weather during this week? c. Was there any severe weather during this week? If yes, what was it? d. What kind of activities could you do in this city during this week? |
|


7. TOO MUCH RAIN
|
🡺 I can describe the effects of flooding due to heavy rain on the human and physical environment.
When there is very heavy rainfall, floods usually occur. The sudden downpour is too much for the ground to soak up in a short amount of time. Water flows everywhere, and rivers may overflow. Confusion and destruction follow as the area begins to flood. During severe floods, furniture, trees, rocks, and even vehicles are carried away by the rushing waters. Drivers are caught inside their cars, houses fill with mud, and the town’s drinking water becomes too dirty for people to use. Every year, more damage is caused, and more lives are lost because of floods than because of lightning, hurricanes, or tornadoes. |
|


Geo-check!
|
The two articles to the right both show flooding incidents, one in Kerala, India and another in Xlendi, Gozo.
1. Write TWO effects of the flood in Kerala and Xlendi you can read from the articles. 2. Add another TWO effects of the floods that are not written in the articles, but you think might happen. 3. Mention THREE differences between the floods in Kerala and Xlendi. |
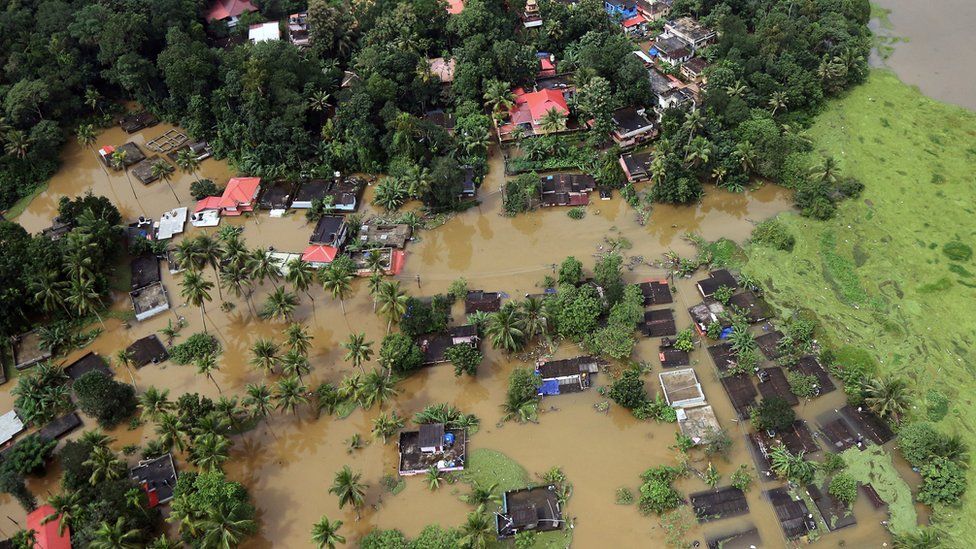
Kerala death toll hits 167!
By Amalie Henden (Aug 17, 2018) The Kerala flooding death toll has risen to 167 since rains began on August 8. More than 200,000 people are currently living in relief camps across the district. Kerala is witnessing its worst flood crisis in almost a century, with the latest flooding being the third since June. Torrential rain, overflowing rivers and landslides have caused trains and metros to suspend their operations and Kochi airport has been forced to shut until August 26. A red alert has been issued by India’s Meteorological Department for most of the Kerala districts for Friday. The Chief Minister of Kerala Shri Pinarayi Vijayan said the water-level in the rivers will continue rise. He has urged people to get on to rooftops so rescue teams can easily spot them and help them to safety. The flood condition is worsening day by day and forecasters do not foresee any relief in the short term. |
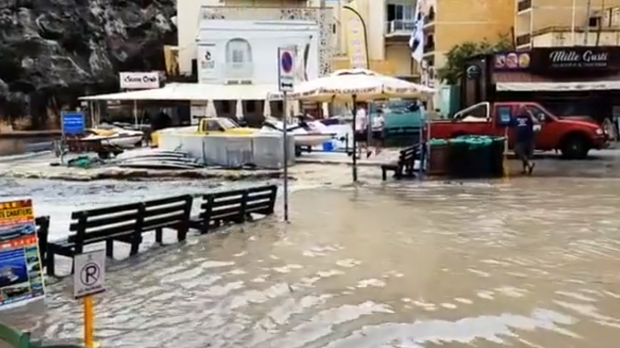
Xlendi flooded as Gozo hit with heavy rains
By Ivan Martin (Aug 22, 2018) Xlendi flooded on Wednesday afternoon after heavy rains in neighbouring towns combined to form a river flowing down to the popular seaside destination. Flooding from heavy downpours are a regular occurrence for Xlendi residents and visitors throughout the winter months. They have often complained of having to wade through several inches of water. Rose Attard, who manages the Boat House Restaurant, told the Times of Malta that the rains often meant businesses having to shut shop for the day. “When it floods here, access is either limited or completely cut off. Cars are not able to reach Xlendi, and those people who are already here won’t be able to get in or out of restaurants,” she said. Gozitan MP Chris Said lamented what he said was a smell of drainage that filled the Xlendi air. The Met Office is predicting more rain for Thursday and Friday, with the sun back in time for the weekend. |
8. HEATWAVES AND DROUGHT
|
🡺 I can describe the effects of heatwaves and drought on the human and physical environment.
A heatwave is a long period of extremely hot weather. Drought usually happens after a long period of dry weather. Droughts can be caused by both the weather and humans. Here are some effects of droughts and heatwaves:
|
|


Geo-check!
|
1. In July 2018, most of Europe went through a heatwave. The UK was affected significantly. The pictures below show how the heatwave has dramatically changed the landscape.
a. Explain the differences can you see in these photos. b. Describe how you think the heatwave affected:
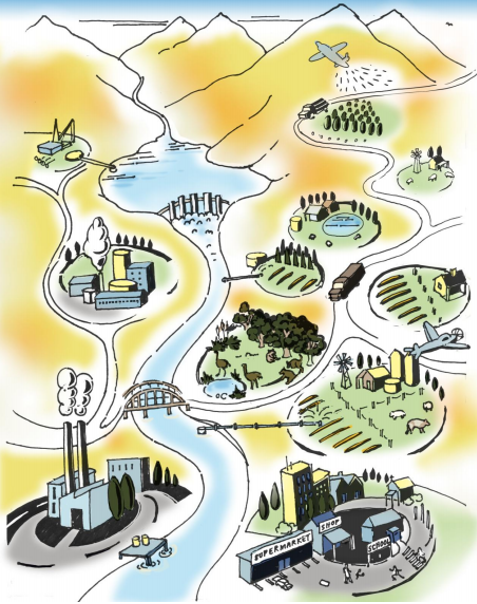
2. The cartoon here shows a city. Label the things that may be affected by a drought. [Hint: dams, transport, food, shop owners, farmers, fields, animals] 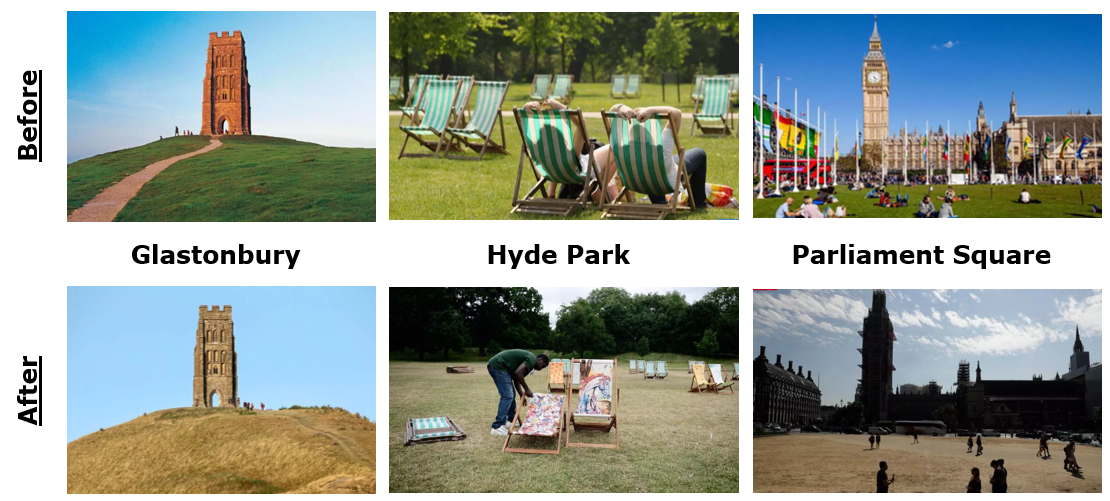
|
|
9. STRONG WINDS
|
🡺 I can describe the effects of strong winds on the human and physical environment.
Wind traveling at different speeds, different altitudes, and over water or land can cause different types of patterns and storms. The type of strong wind we hear about most in the news is the hurricane, however some others are tornados, cyclones and medi-canes (Mediterranean hurricane). Here are some effects of strong winds on the environment:
|
|


Geo-check!
|
1. Describe how might strong winds affect the following in Malta:
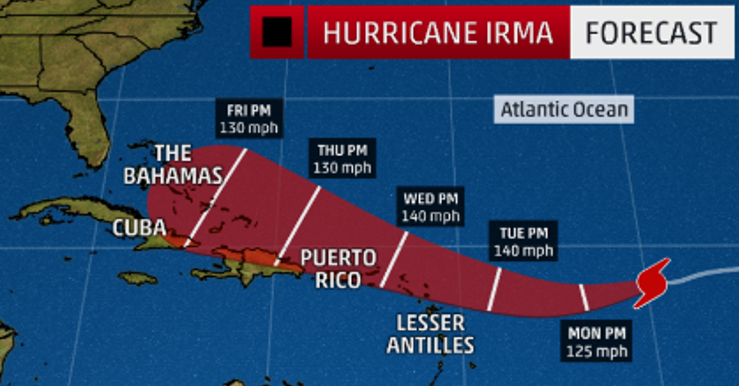
2. The image here shows a forecast of Hurricane Irma. On Monday 4th September 2017, meteorologists forecasted that the hurricane will hit the islands in 24 hours. Imagine you are these people below. Describe what you would do.
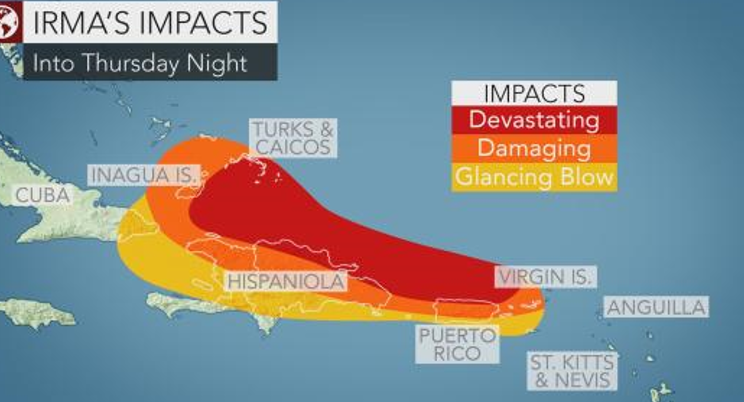
3. The map here shows the impacts of Hurricane Irma the Caribbean Islands. What kind of impacts do you think the hurricane has in areas that are shown as:
|
|
