
NOTE: This is PART 1 of this unit.
PART 2 covers Hurricanes, microclimate and Weather in Malta. These are lessons 8 - 11. |
What instruments are used to measure the weather? What is a synoptic map and why does it have so many lines? Does it always rain in the same way? Why do depressions occur in winter? and what's the difference between an anticyclone in summer and winter? Don't let all these question fog your mind! Let's get learning!
The lessons covered in PART 1 of this unit are: 1. Elements of weather 2. Climate graphs 3. Weather maps 4. Factors affecting climate 5. Types of rainfall 6. Depressions 7. Anticyclones |
1. ELEMENTS OF WEATHER
|
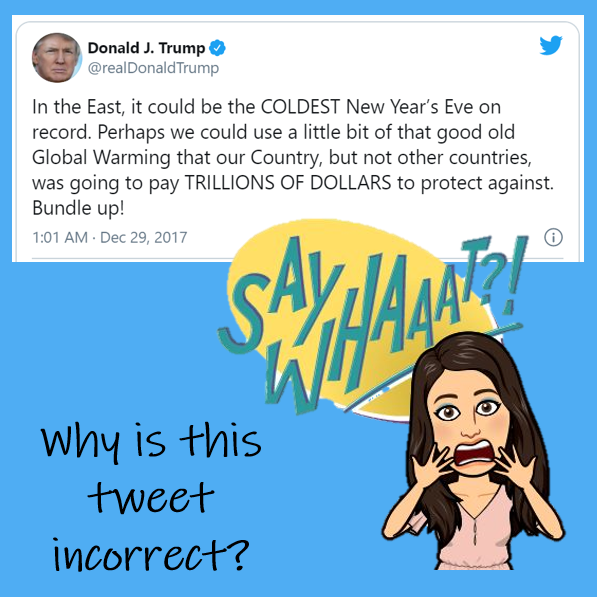
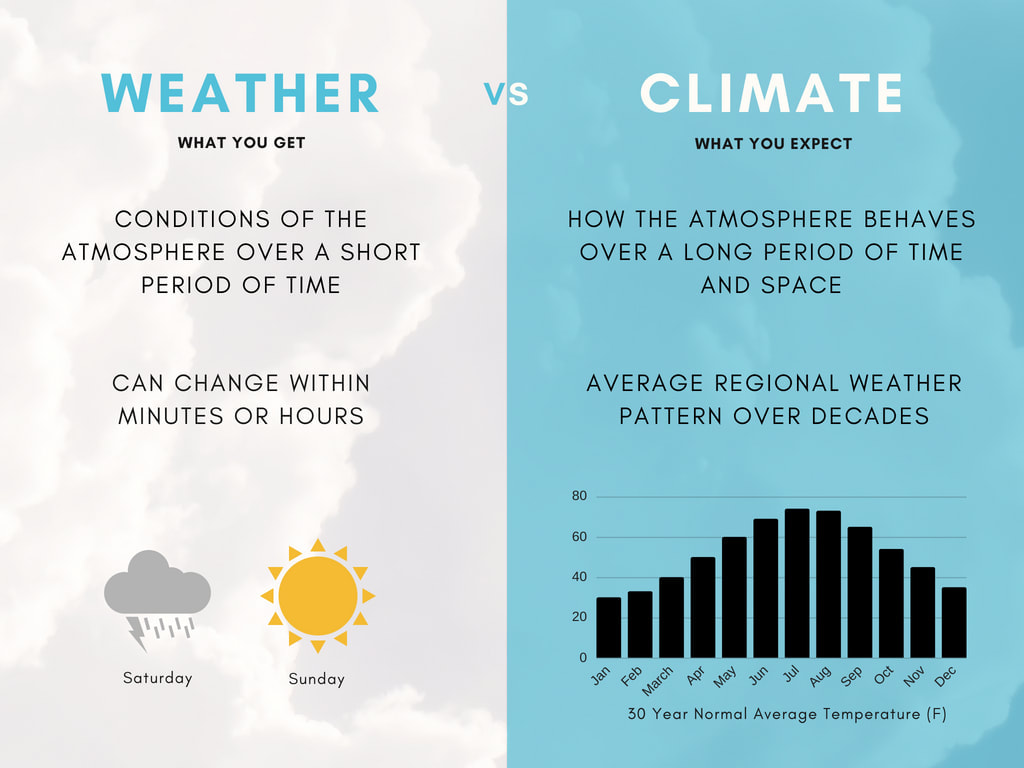
🡺 Understand the difference between weather and climate.
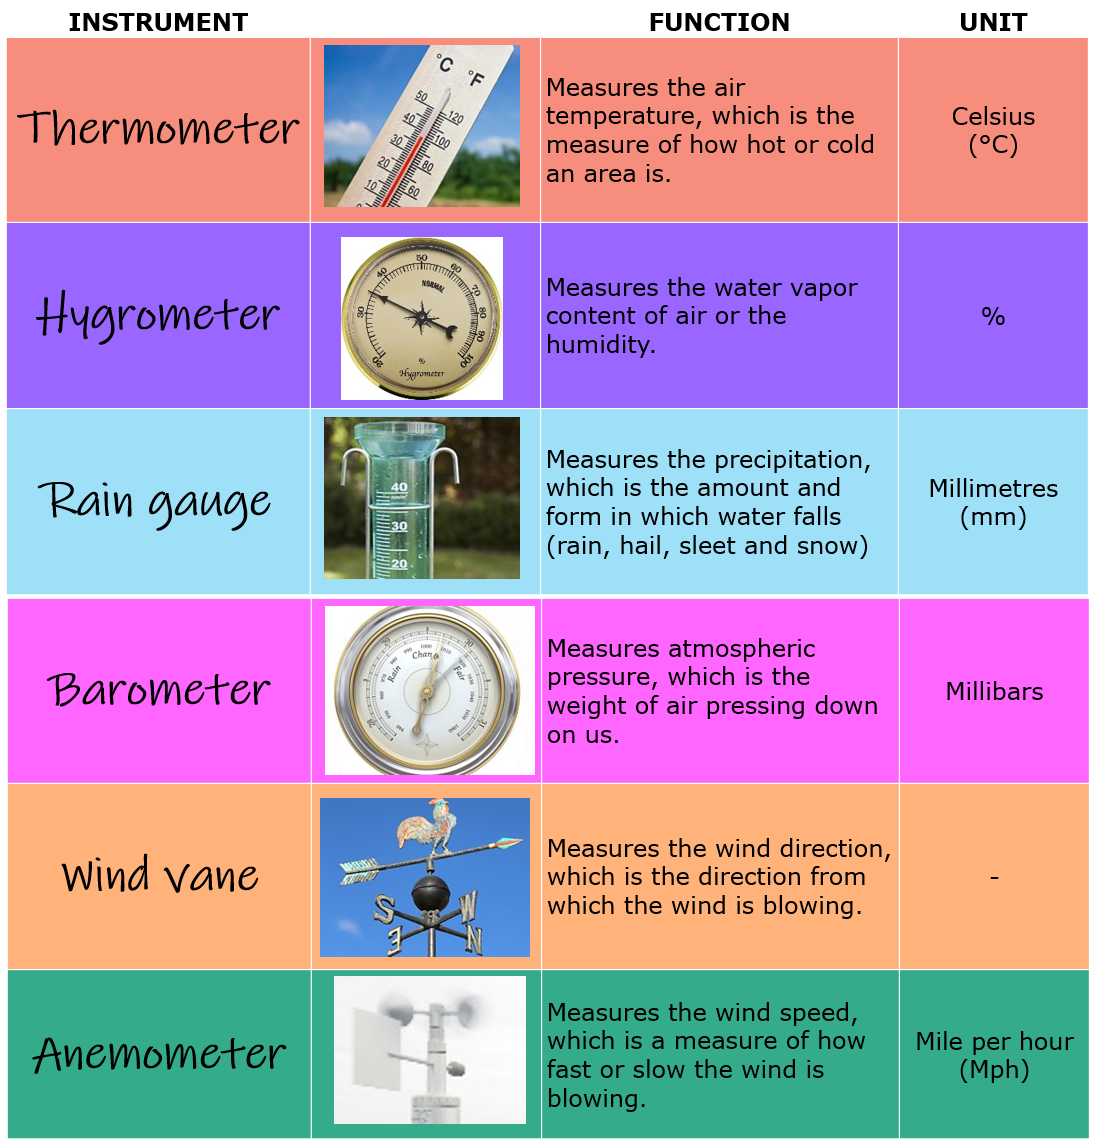
🡺 Recognise the main weather instruments and their purpose: thermometer, hygrometer, rain gauge, barometer, wind vane and anemometer. 🡺 Know the units of measure of each instrument. 🡺 Understand the characteristics of the Stevenson Screen. Weather
Climate
The table below shows a number of weather instruments and their functions. A Stevenson Screen houses a thermometer, hydrometer and other weather instruments. Its screen is so built that the shade temperature of the air can be measured. It is a wooden box whose four sides are louvered to allow free entry of air. The roof is made of double boarding to prevent the sun’s heat from reaching the inside of the screen, and insulation is further improved by painting the outside white. It is placed on a stand, 1m above ground level. 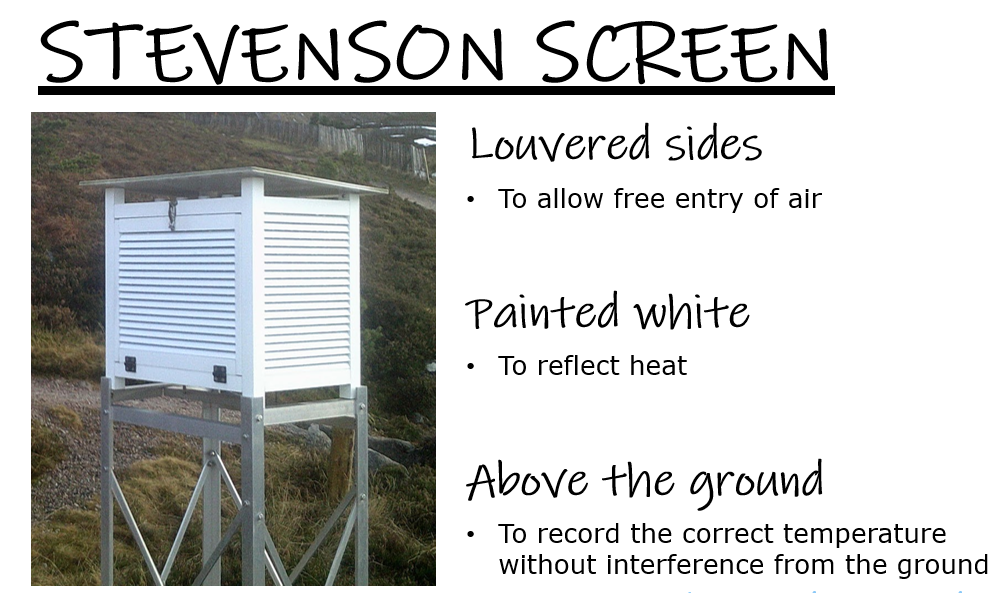
|
|
Geo-check!
|
1. What is the difference between climate and weather?
2. Label the Stevenson screen clearly. 3. Answer these questions about the screen. i. Why does it stand well clear of the ground? ii. Why are the sides louvred? iii. Why is it painted white? 4. Answer the following a. Which weather element is measured with: i. a barometer? ii. an anemometer? iii. a hygrometer? b. What weather instrument is used to measure: i. how hot or cold the air is? ii. the direction of the wind? |
|

2. CLIMATE GRAPHS
|
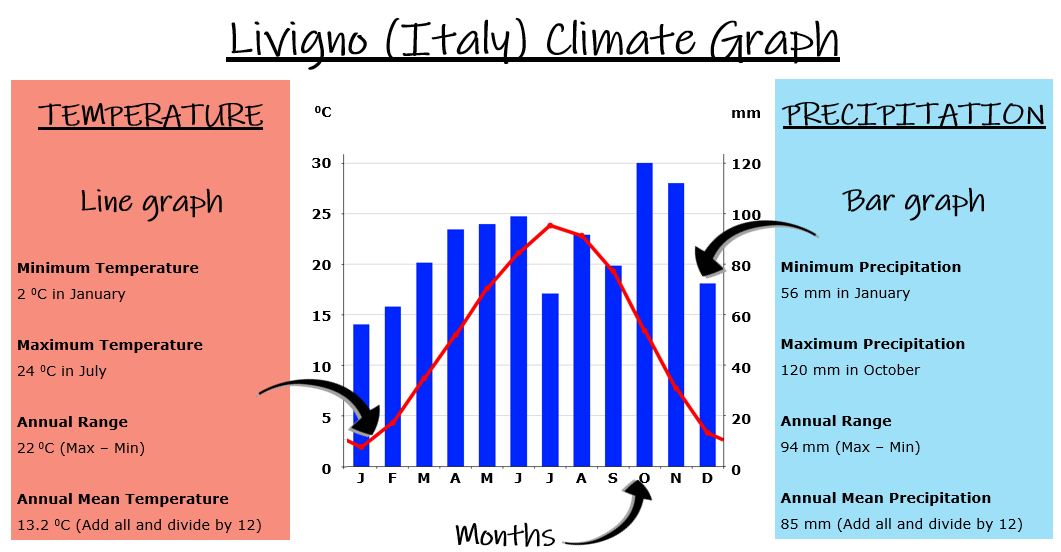
🡺 Construct and interpret temperature and rainfall graphs with data given.
🡺 Use simple calculations to find out the: mean daily temperature; daily range of temperature; mean monthly temperature; mean annual temperature; and the mean annual range of temperature. Here you can see a Climate Graph showing both temperature and precipitation. |
|
Geo-check!
Skills of this topic will be tested in Lesson 11. The Maltese Islands Weather.
This can be found at the end of Weather and Climate Part 2.
This can be found at the end of Weather and Climate Part 2.

3. WEATHER MAPS
|
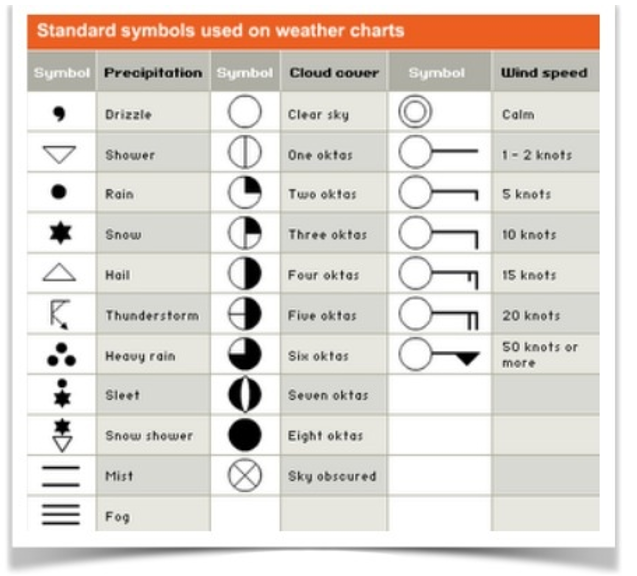
🡺 Read and interpret simple weather charts containing isobars, wind direction and strength, cloud cover and weather symbols.
🡺 Interpret simple satellite photos. The daily weather map aims to give a clear but simplified forecast. This means that the symbols should be understood by the average viewer. Synoptic charts produced by the Meteorological Office use official symbols to show conditions at specific weather stations. Weather stations show five weather elements: temperature, wind speed, wind direction, cloud cover and type of precipitation. A sixth element, atmospheric pressure, can be obtained by interpreting the isobars. |
|
Geo-check!
|
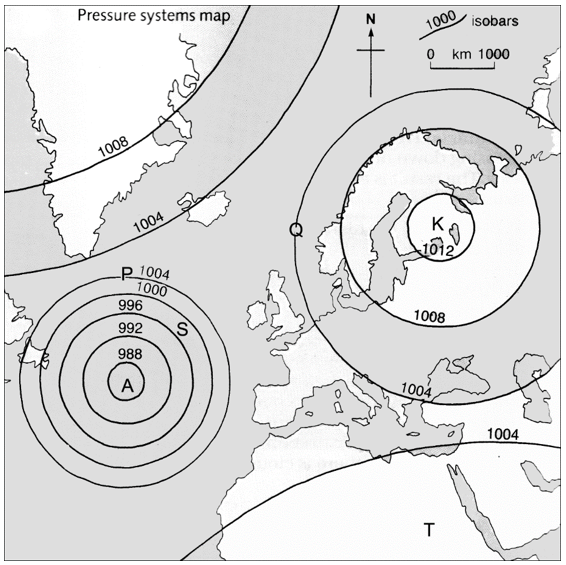
1. Answer the following questions using the synoptic chart here.
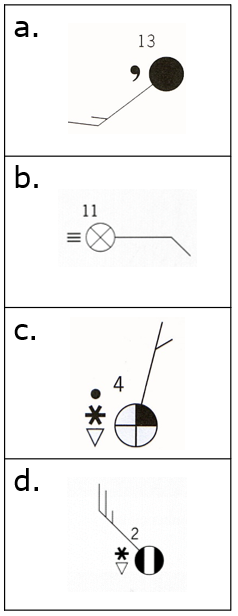
a. The air pressure at P is _____________millibars. b The pressure at Q is ____________________ . c The pressure is lowest at the place labelled __________ on the map. It is about ______________ . d. Which letter shows a place at high pressure? e. Which place is likely to be windier, S or T? Why? f. Which place is more likely to have rain, K or A? Why? 2. On synoptic chart here: a. Mark by the letter A, an area with an atmospheric pressure of 1008 mb. b. Mark by the letter B, an area with an atmospheric pressure of 1000 mb. c. Name two countries with an atmospheric pressure reading of 992 mb. d. Mark by the letter C, the area with the lowest pressure. e. Name two countries under the influence of a high pressure. f. Mark by the letter D an area under strong winds. g. Mark an area experiencing calm conditions. 3. Meteorologists use standard symbols on synoptic charts to provide information about precipitation, cloud cover, wind and temperature. a. Describe the weather conditions at each of the following four stations on the right (a to d)
b. Then draw the following weather stations using the information provided. Station 1 Temperature: 30ºC Present weather: fog Wind direction: NE Wind speed 2 knots Cloud cover 3 oktas Station 2 Temperature: 6ºC Present weather: rain Wind direction: SW Wind speed 25 knots Cloud cover 7 oktas Station 3 Temperature: 15ºC Present weather: sleet Wind direction: NW Wind speed 35 knots Cloud cover 6 oktas 4. Study the weather map and on it write in the appropriate place. a. HP for High Pressure b. LP for Low Pressure c. Insert the symbol for drizzle at the Algeria weather station. d. Shade two areas with strong winds. e. Where do you think the pressure is lowest? What is the air pressure? f. What kind of weather do you think place B on the map is experiencing? g. Describe the weather at the following stations:
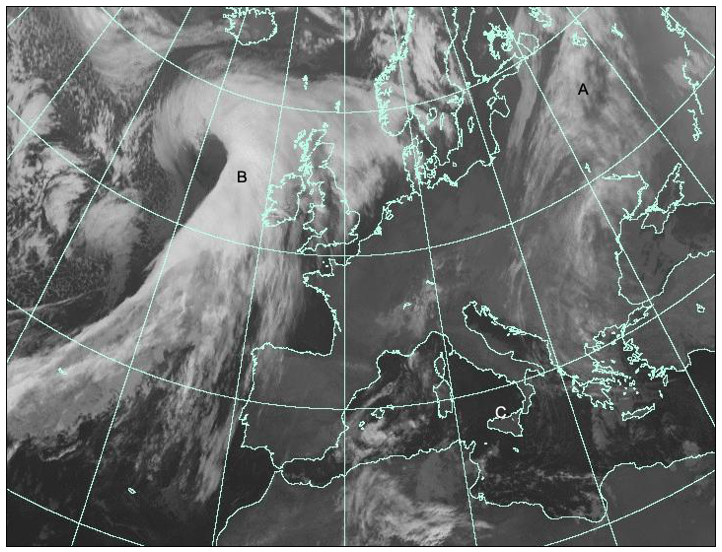
5. Satellite images as well as weather charts to predict more accurately the weather. These are not photographs but infra-red images showing heat emitted – the coldest areas are white, the warmest black. a. Where is the cloud higher at A or at B? b. Imagine you where on the beach at C at the time. Which country is C in? Was it sunny or cloudy? How can you tell? c. Which was warmer that day, the Mediterranean Sea or the Atlantic Ocean? How can you tell? 6. Refer to the satellite image here. a. Mark by the letter A where the cloud is higher. b. Name four important European cities that were under heavy cloud cover, perhaps 8 oktas, when the image was taken. c. Which of these three places do you think is having the worst weather: Tunis / Rome / Paris d. The weather over Malta is wet and windy or warm and dry. What will be the weather forecast for Malta for the coming days. |
Question 1
Question 2

Question 4
Question 5
Question 6
|

4. FACTORS AFFECTING CLIMATE
|
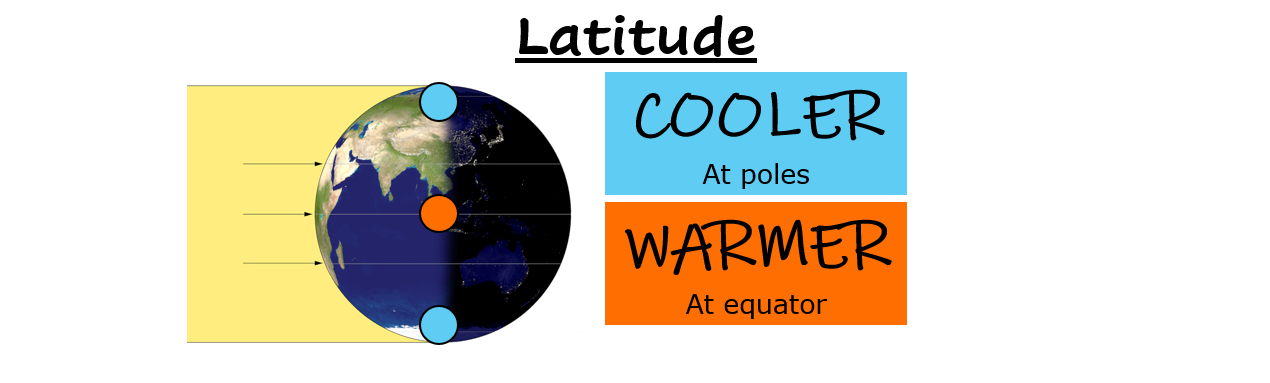
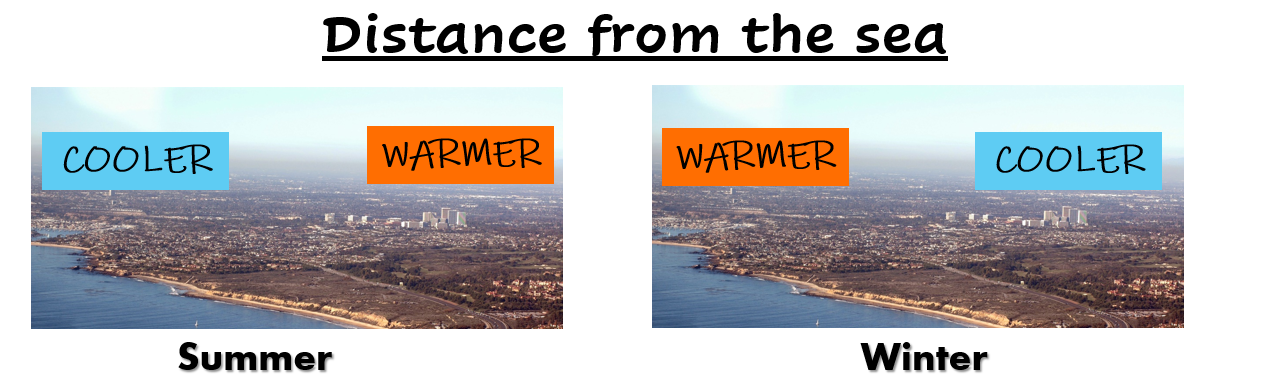
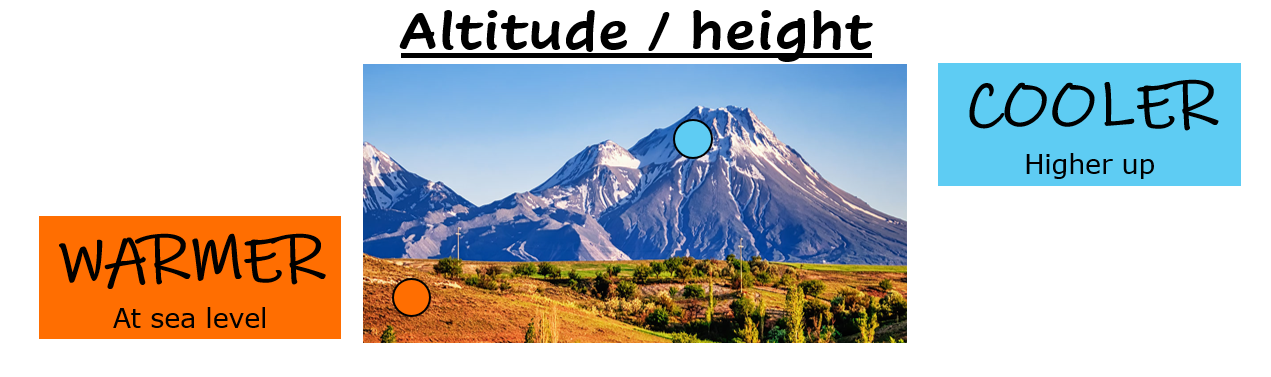
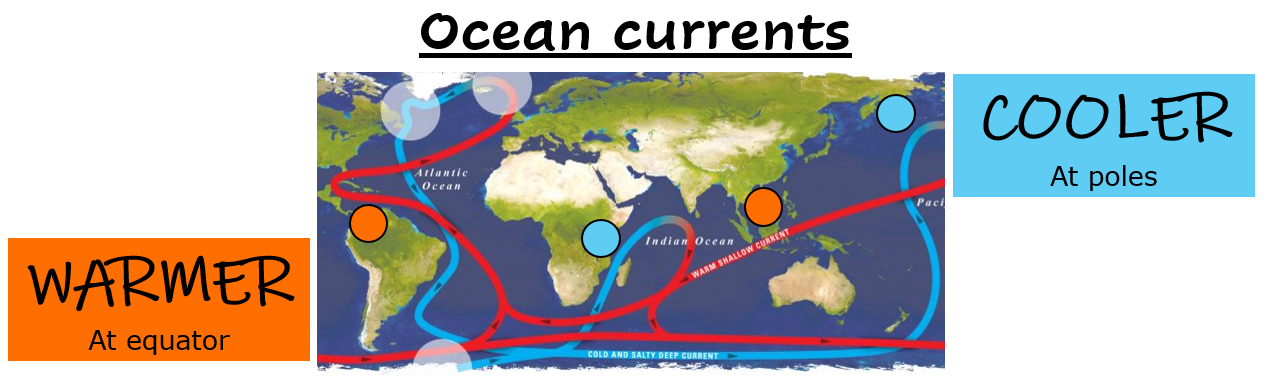
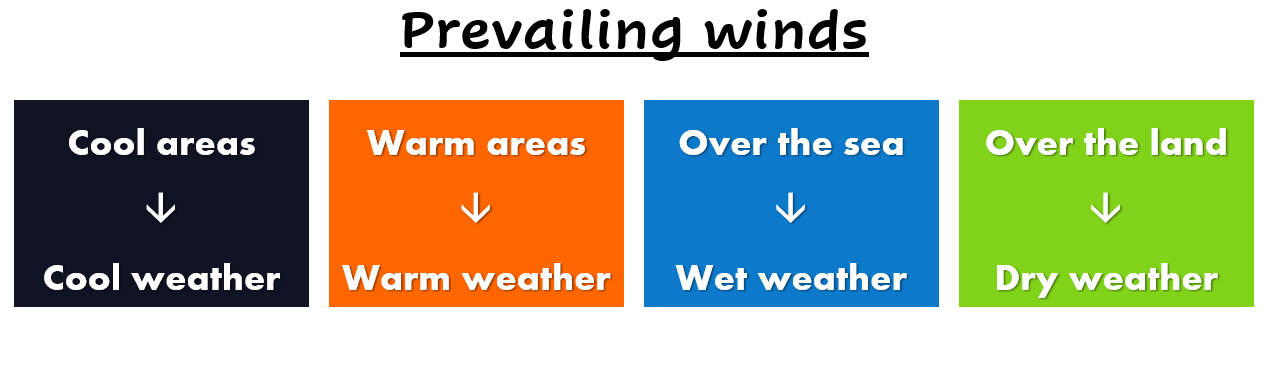
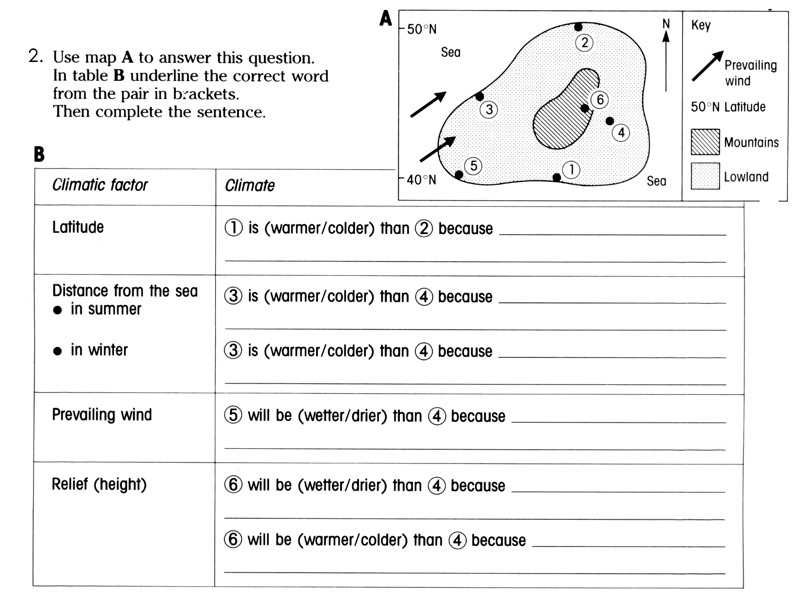
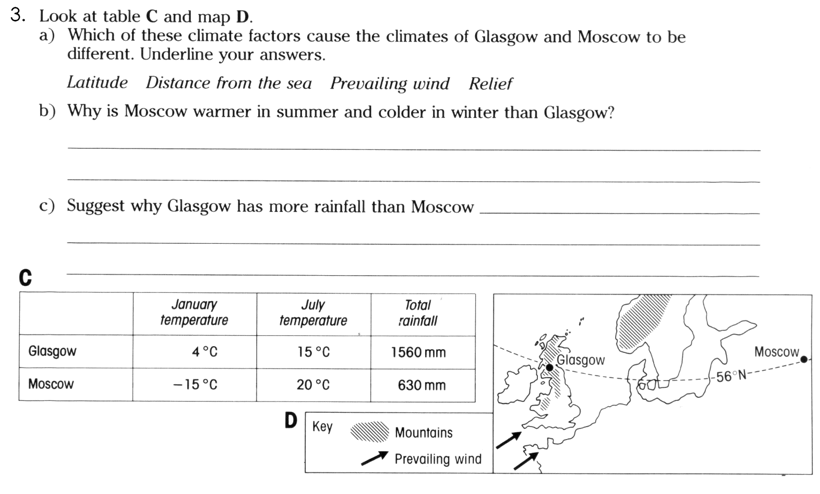
🡺 Understand how latitude, the sea, height, prevailing winds and ocean currents affect the climate of an area.
Latitude
Distance from the sea
Altitude / height
Ocean currents
Prevailing winds
|
|
Geo-check!
|
|

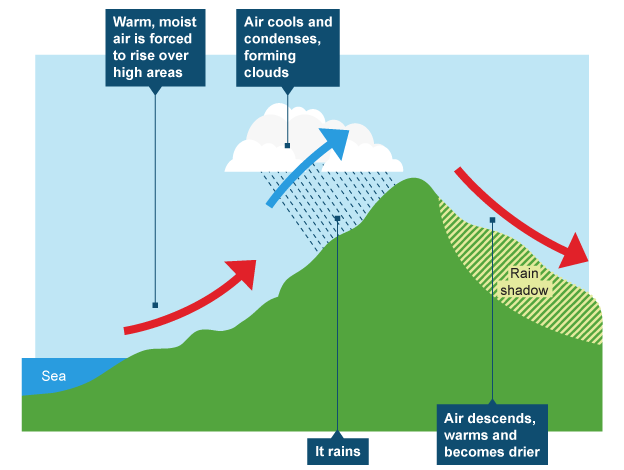
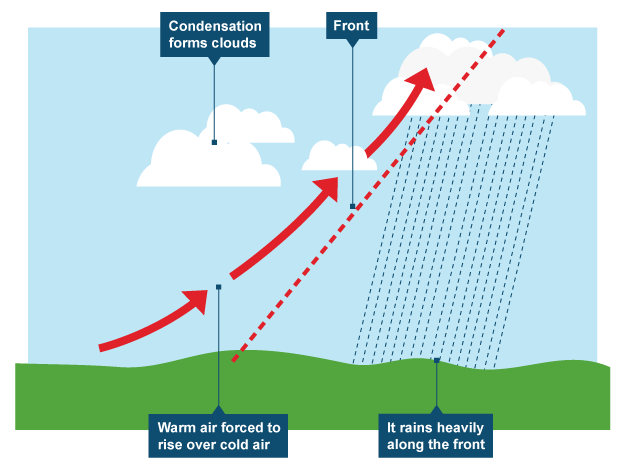
5. TYPES OF RAINFALL
🡺 Distinguish between the three types of rainfall
There are three main types of rainfall.
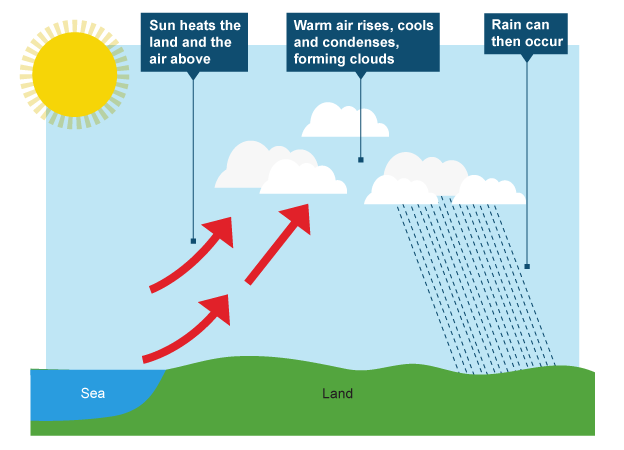
In all three cases, rainfall results from warm, being forced to rise until it cools enough for condensation to take place.
There are three main types of rainfall.
In all three cases, rainfall results from warm, being forced to rise until it cools enough for condensation to take place.
|
Relief rainfall
This is sometimes called Orographic rainfall. 
|
|
|
Frontal rainfall
|
|
|
Convectional Rainfall
|
|
Geo-check!
|
1. Draw well labelled diagrams for each of the three types of rainfall.
You can use the video to help you label this diagrams! |
|

6. DEPRESSIONS
|
🡺 Be aware of the typical sequence of weather during the passage of a mid-latitude depression including air pressure, wind direction, rainfall and temperature.
🡺 Understand the meaning and sequence of the warm front, warm sector, cold front and occluded front. 🡺 Identify the above fronts and sector on a weather chart. Interpret the pattern of isobars on a weather chart. 🡺 To forecast the weather for a particular locality shown on the weather chart that shows a mid-latitude depression. 🡺 Compare satellite images showing a mid-latitude depression to the relative weather chart. Depressions – areas of low pressure which bring rain, cloud and wind. IMPORTANT: They move anticlockwise! HOW DO THEY FORM?
WHAT HAPPENS AS THE DEPRESSION PASSES? Warm front approaching
During the warm sector
Passing of the cold front
When the front passes
|

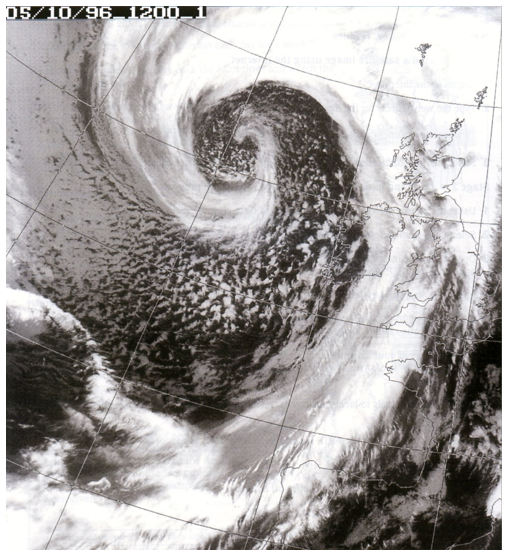
Look at the depression form in the middle of the image, toward the top.
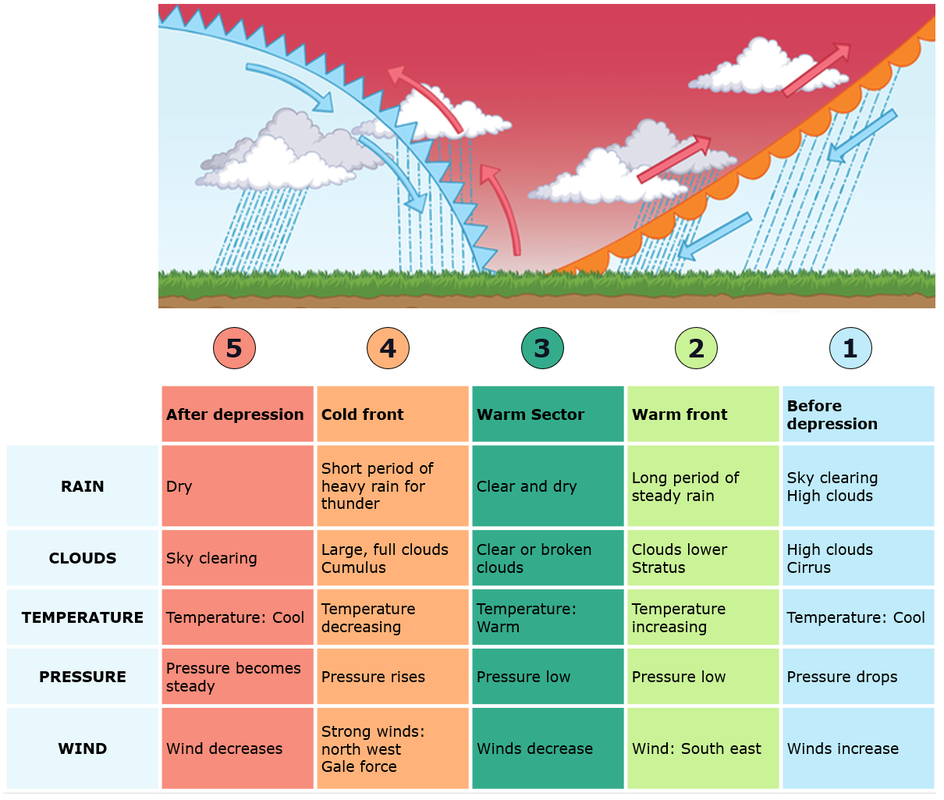
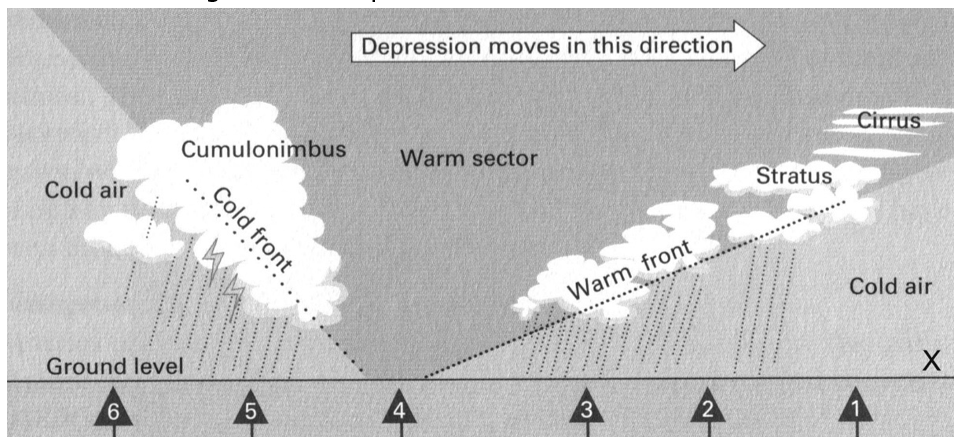
Cross-section diagram of a depression
|
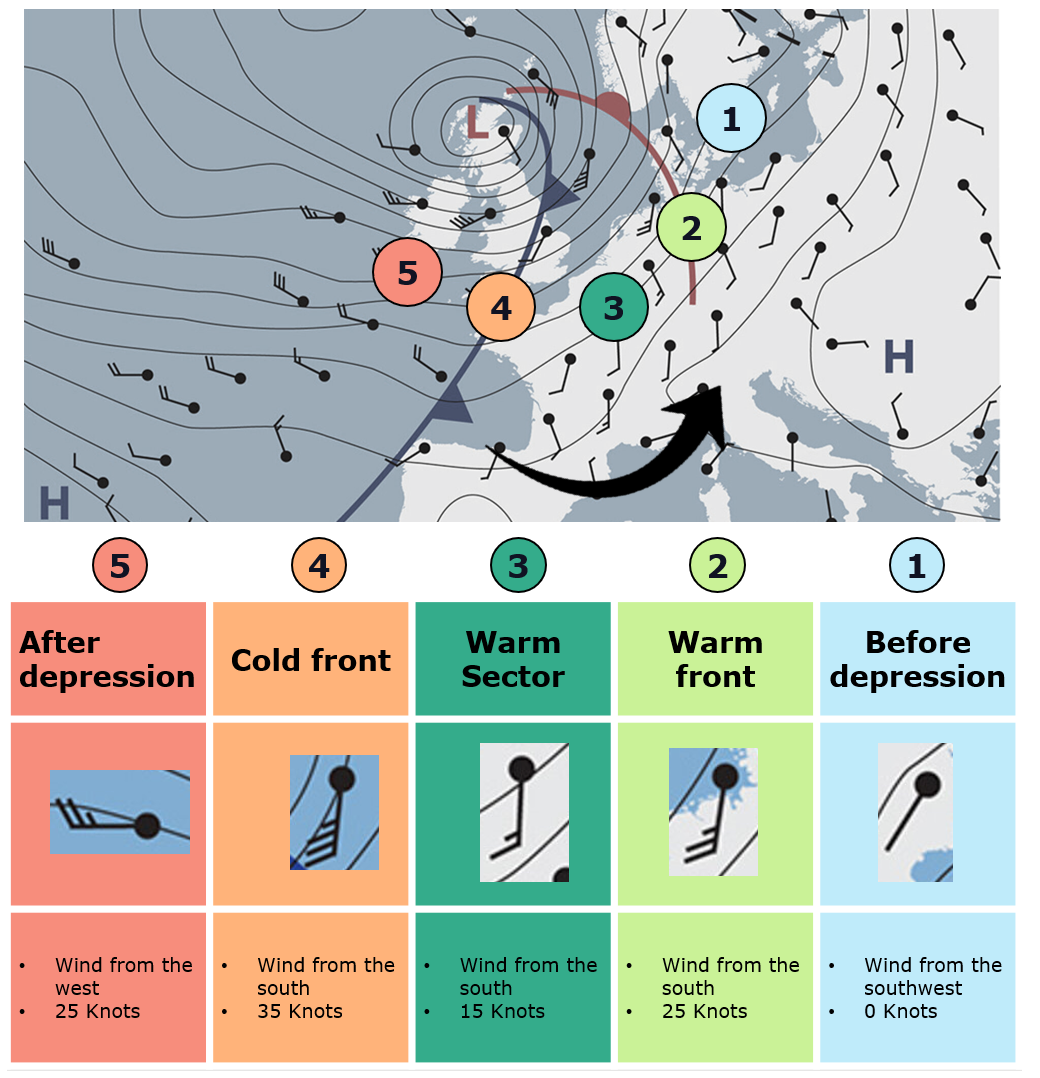
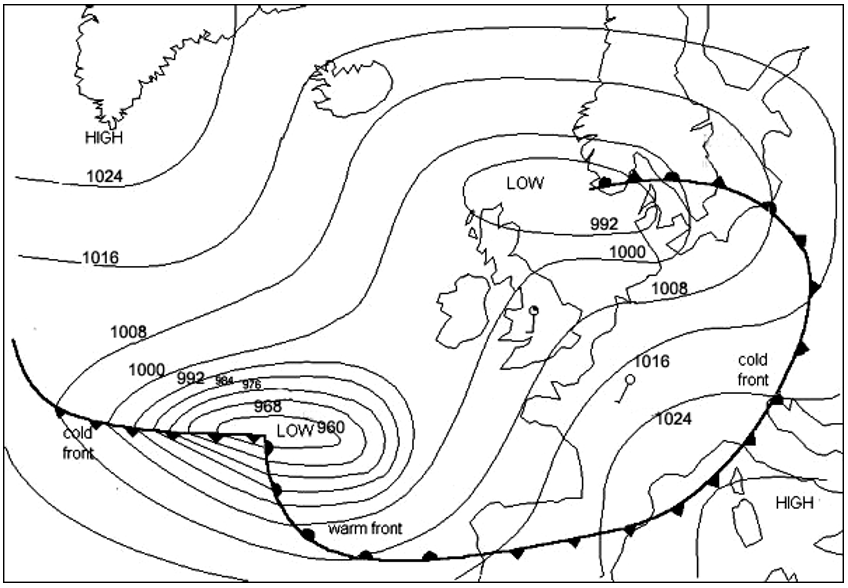
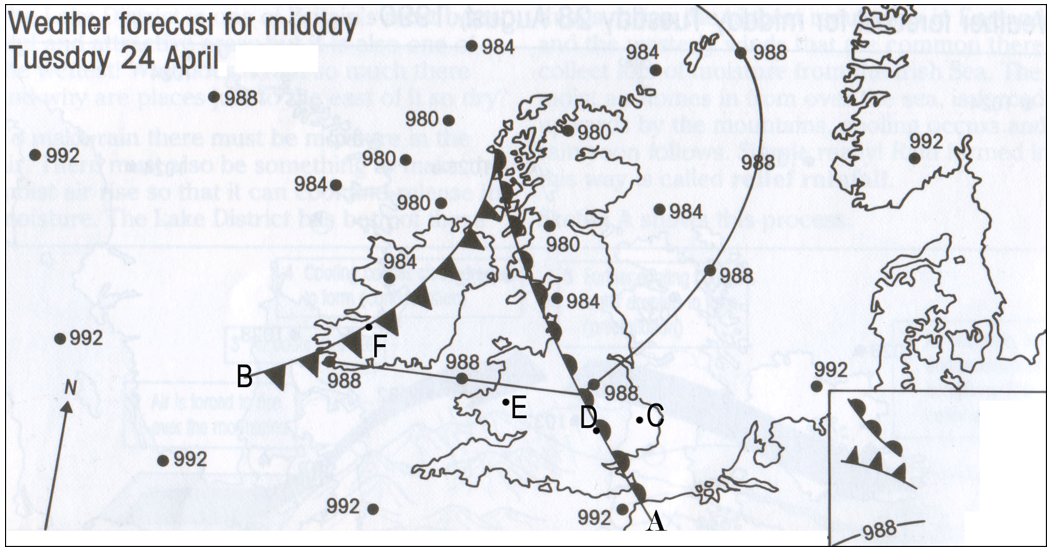
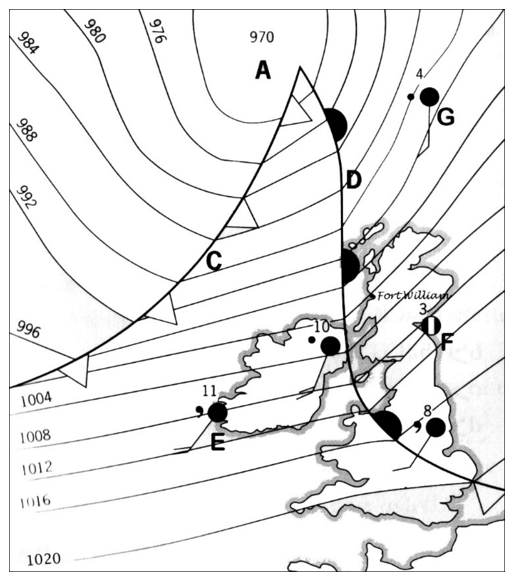
Synoptic map of a depression over the UK
|
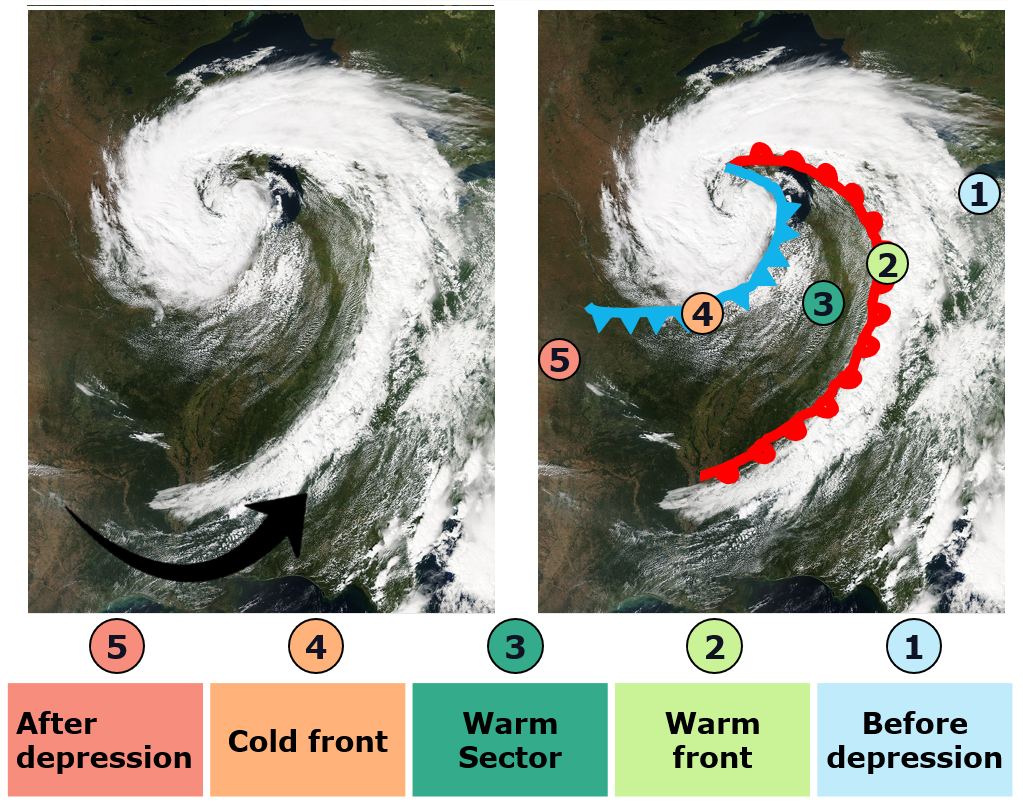
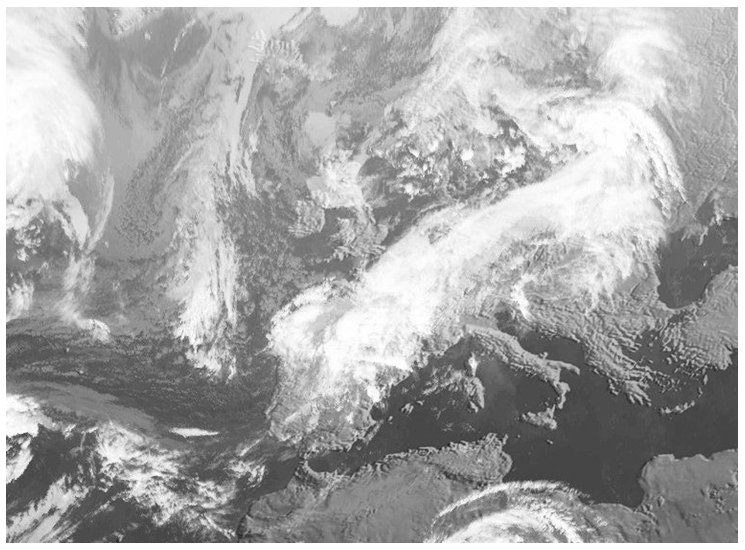
Satellite image of a depression
|
Geo-check!
1. Answer briefly the following questions.
a. What is a depression?
b. What instrument is used to measure air pressure?
c. What unit of measurement is used to measure air pressure?
d. Where do depressions form?
e. What causes depressions to form?
f. What is a front?
g. Why is it impossible that the two air masses mix together?
h. What happens at the front?
i. What type of rainfall is associated with a depression?
j. What direction do depressions travel?
|
2. The diagram here is a cross-section through a depression. Imagine that you are standing at point X on the cross section with the depression coming towards you. Explain how the weather will change as the depression moves from west to east.
|
Question 2
|
|
3. It is quite easy to forecast the weather in a depression because there is a regular pattern of cloud types and rain.
a. Complete the weather map by drawing in the isobars for 980, 984, 988 and 992 millibars. Part of the 988 has been done to help you. b. Label each isobar with its pressure. c. Write Low at the centre of the depression. d. Draw arrows on the isobars to show wind direction. e. Name the features A and B. f. What is the lowest air pressure shown on the map? g. Identify the type of weather system. h. Using the map describe the weather being experienced at C, D, E and F. |
Question 3
|
|
4. Finish the map by joining up figures of the same value. The lines you have drawn are called isobars.
a. Shade in the area ringed by 1020 isobar. Label it high pressure. (HP) b. Shade the area ringed by 992 isobar. Label it low pressure. (LP) c. Draw a warm front joining the points B and C. d. What type of weather is associated with this type of front? e. Draw a cold front joining the points B and D on the weather chart. f. What type of weather is associated with this type of front? g. Join points A and B on the map. Draw the symbol for an occluded front. |
Question 4
|
|
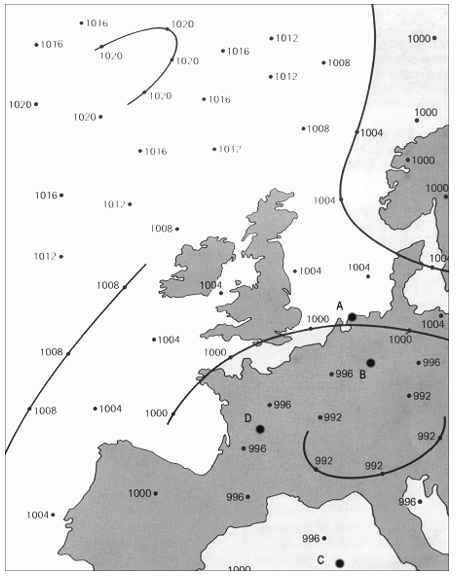
5. Refer to the map showing a depression here.
a. Where on the map do you think the pressure is lowest? b. Name the weather symbols C and D. c. Draw a weather station model in the box below for Fort William to show:
d. What is the temperature, cloud cover, precipitation, wind direction and pressure at E, F and G. e. The weather system is predicted to move in an easterly direction over the next 24 hours. Describe the sequence of weather that would be experienced in Fort William during this period. |
Question 5
|
|
6. Study the satellite picture of a depression passing over western Europe. Mark on the photo:
|
Question 6
|
|
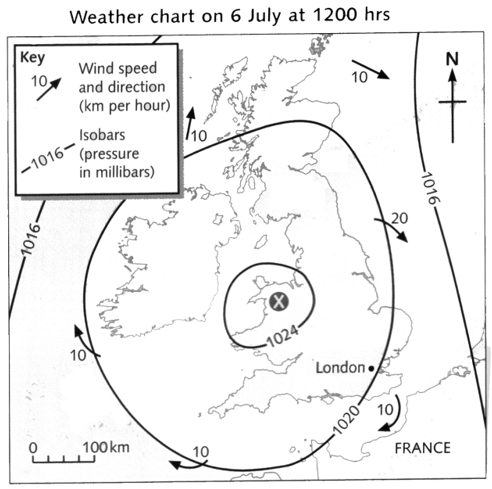
7. Look at the weather map and complete the following sentences.
a. Choose your answers from the brackets.
b. Give a simple weather forecast for London. c. Describe the weather that this same system may bring to London on a winter’s day. |
Question 7
|

7. ANTICYCLONES
|
🡺 Demonstrate the main features of an anticyclone including pressure, movement and weather conditions.
🡺 Describe the weather conditions of a summer anticyclone. 🡺 Describe the weather condition of a winter anticyclone. 🡺 Comprehend a weather chart showing an anticyclone area. Anticyclones are opposite to depressions:
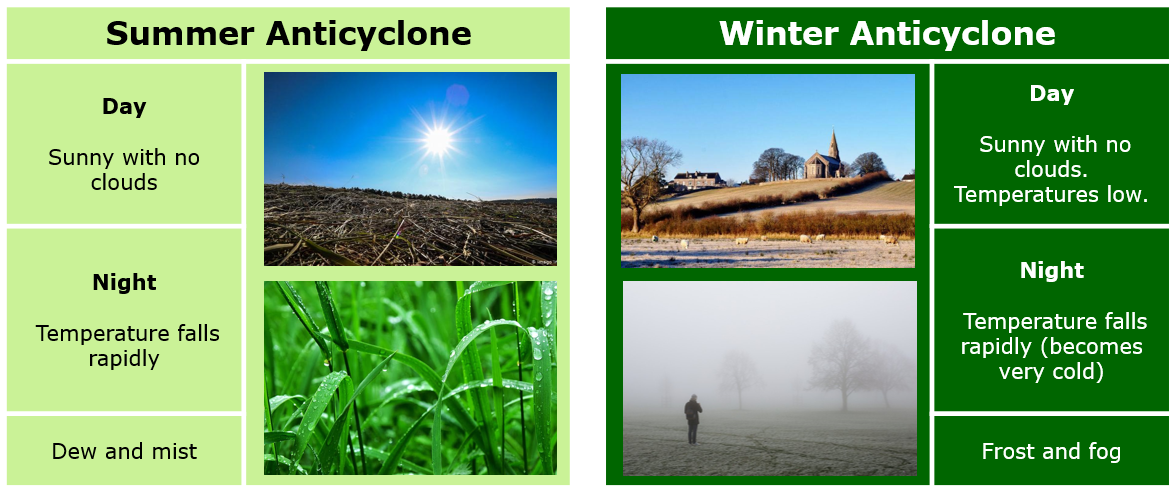
Summer anticyclone
Winter anticyclone
|
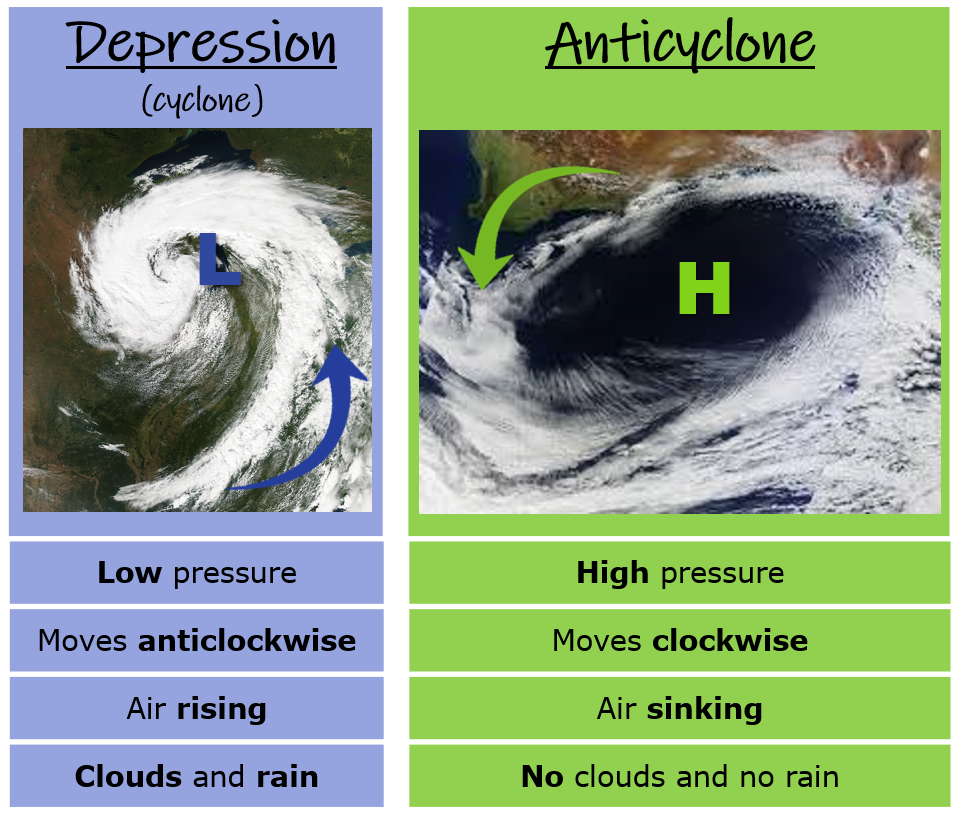
Differences between a cyclone and anticyclone.
|

|
|

This is a weather report from Maltese Islands Weather. It shows the main characteristics of a SUMMER ANTICYCLONE. Click on the image to read the whole article.
Geo-check!
|
1. Fill in the passage using the terms supplied.
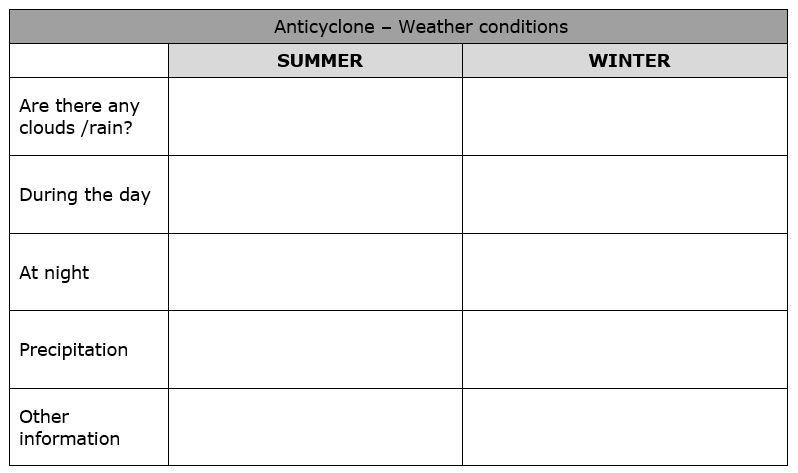
clear skies / summer / high pressure / stationary / cold Anticyclones are areas of ____________________ in which air descends. They can remain ____________________ for several days. An anticyclone is usually accompanied by ____________________ which give very warm temperatures in ____________________ and very ____________________ in winter. 2. In the table here write the weather conditions associated with a summer anticyclone and a winter anticyclone. 3. Place the following weather conditions under the appropriate heading: Depression (cyclone) OR Anticyclone.
|
|
|
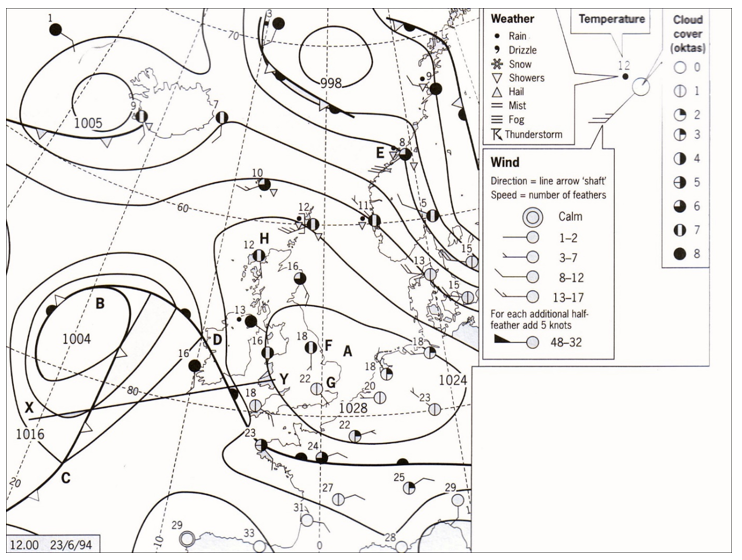
4. Study carefully the weather map below.
a. Name the following features:
b. Describe the current weather at stations E and F c. Draw the symbol for these stations: Station A
Station B
|
|