
|
Where do people live around the world? Why do so many people live in India and China? Where in the world are the fastest growing populations? What does the population structure tell us about a country? Why do some countries have very high birth rates? Why does birth rate decrease as a country develops? We'll learn all about this and more in this unit!
The lessons covered in this unit are: 1. Distribution of population 2. World population growth 3. Population growth in LEDCs 4. The Demographic Transition Model 5. Population structure 6. Changing structures 7. Case study: Brazil - Density and distribution 8. Case study: China: Controlling population growth 9. Case study: Italy – An ageing population |

|
1. DISTRIBUTION OF POPULATION
|
🡺 I know the meaning of the following terms: sparsely, densely, high and low population density.
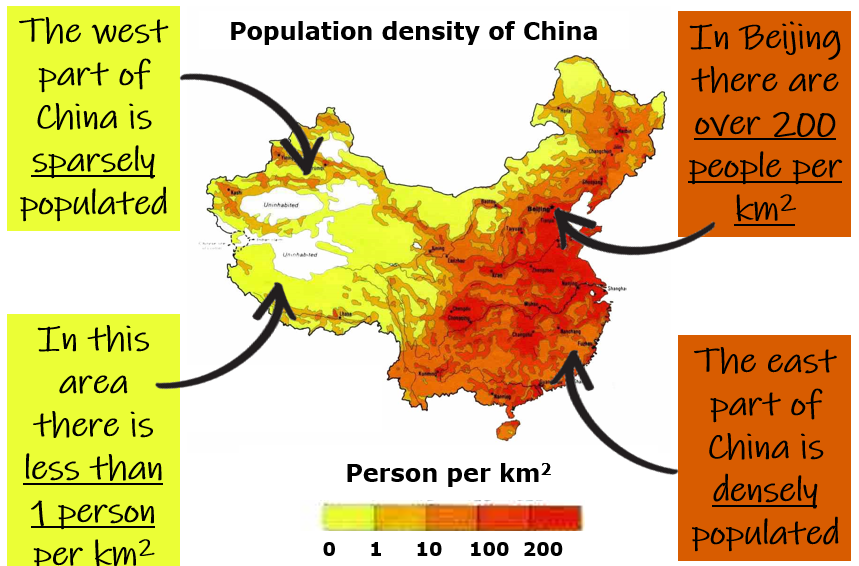
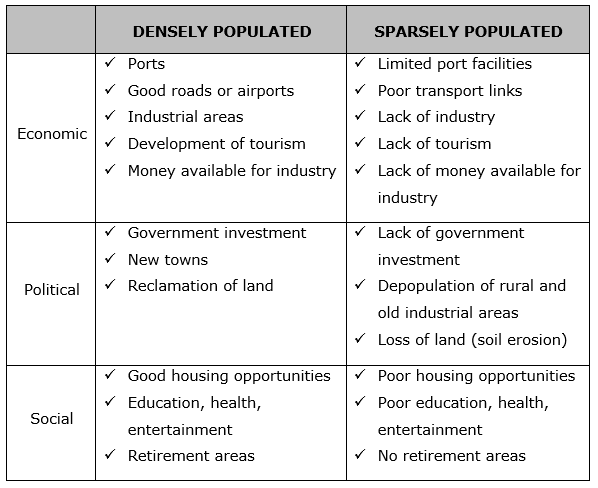
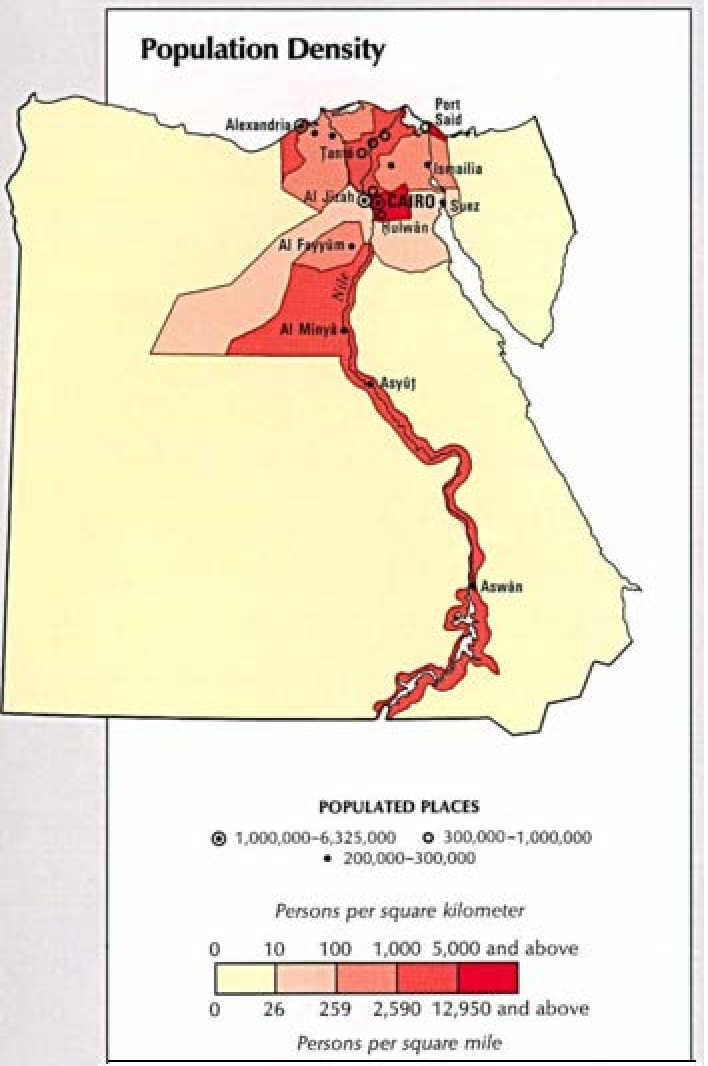
🡺 I can identify places with high or low population densities. 🡺 I am capable of finding population densities from given data of area. 🡺 I can explain the physical factors affecting distribution of population. 🡺 I can explain the human factors affecting distribution of population. World population distribution describes how people are spread out across the globe. The human population is not spread evenly. Few people live in locations that are sparsely populated and densely populated places have many. The distribution of people is often shown using a dot distribution map. Here are some reasons places may be sparsely or densely populated: Density describes the number of people living in a given area. Density is calculated like this: Population density = Total population ÷ Total land area in km² Choropleth maps usually show generalisations. Sometimes, they hide concentrations eg. Brazil and Egypt. 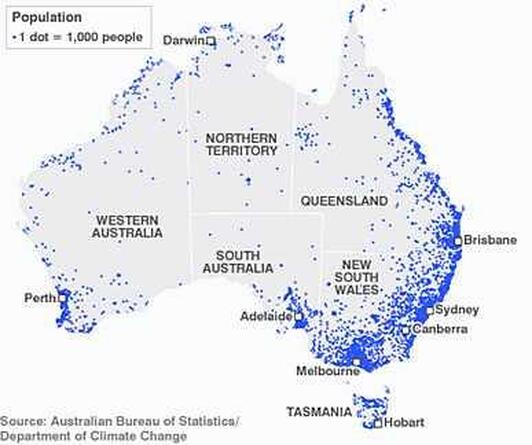
On this dot map of Australia, 1 dot shows 1,000 people.
Click on the image to zoom into the map!
|
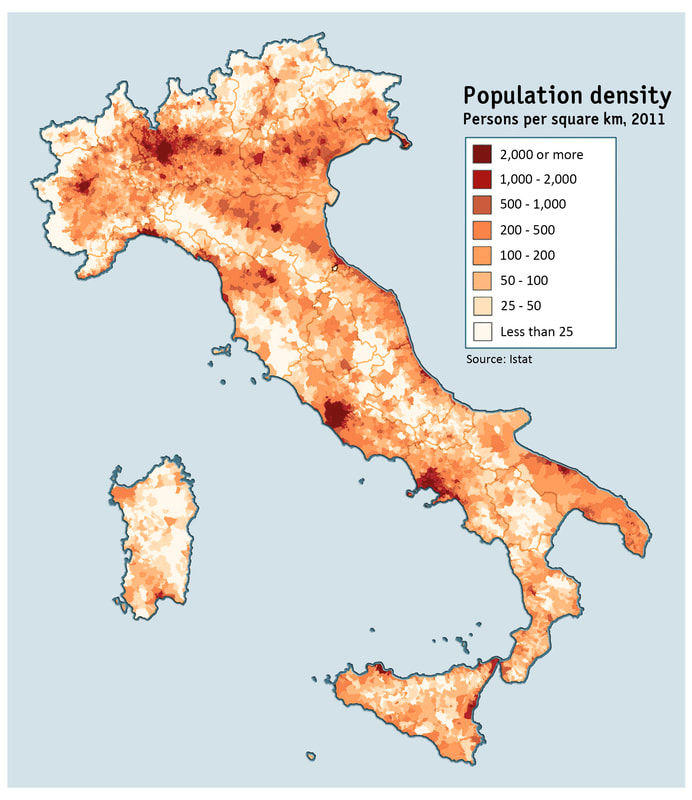
This is a choropleth map of Italy. The darker colours show a higher population density.
|
Geo-check!
|
1. The dot map below shows the worlds population. Write down FOUR facts about the distribution of the world’s population.
|
|
|
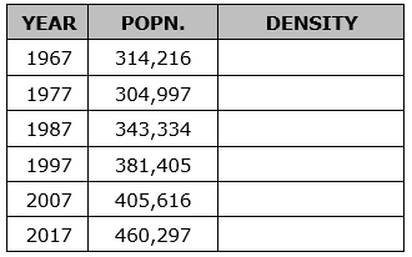
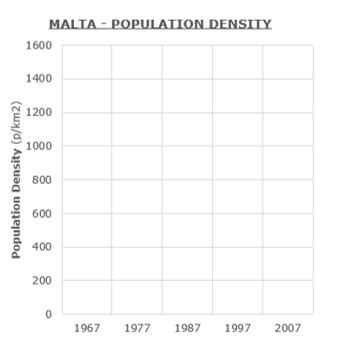
2. Malta’s population has been rising over the decades. We know that the area of the Maltese Islands is 312 km2. Using the information below, work out the population density for Malta, and mark them on the graph.
|
|
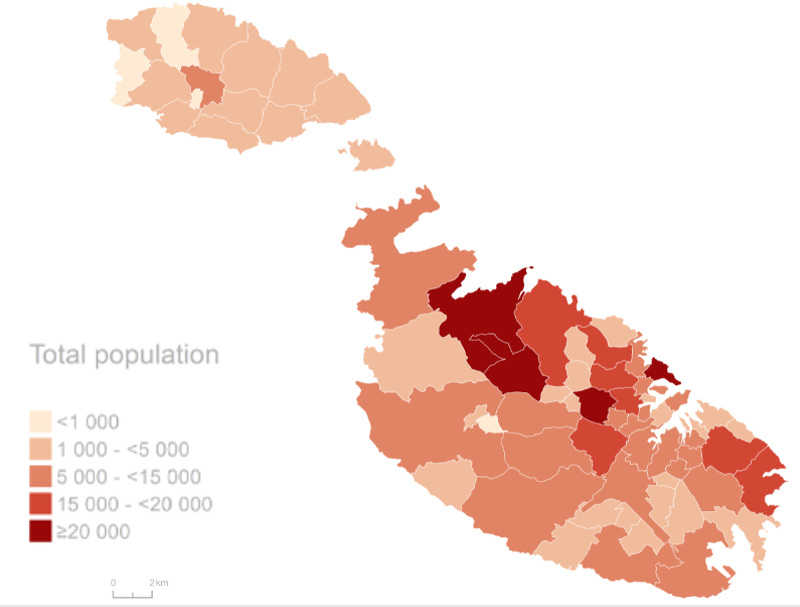
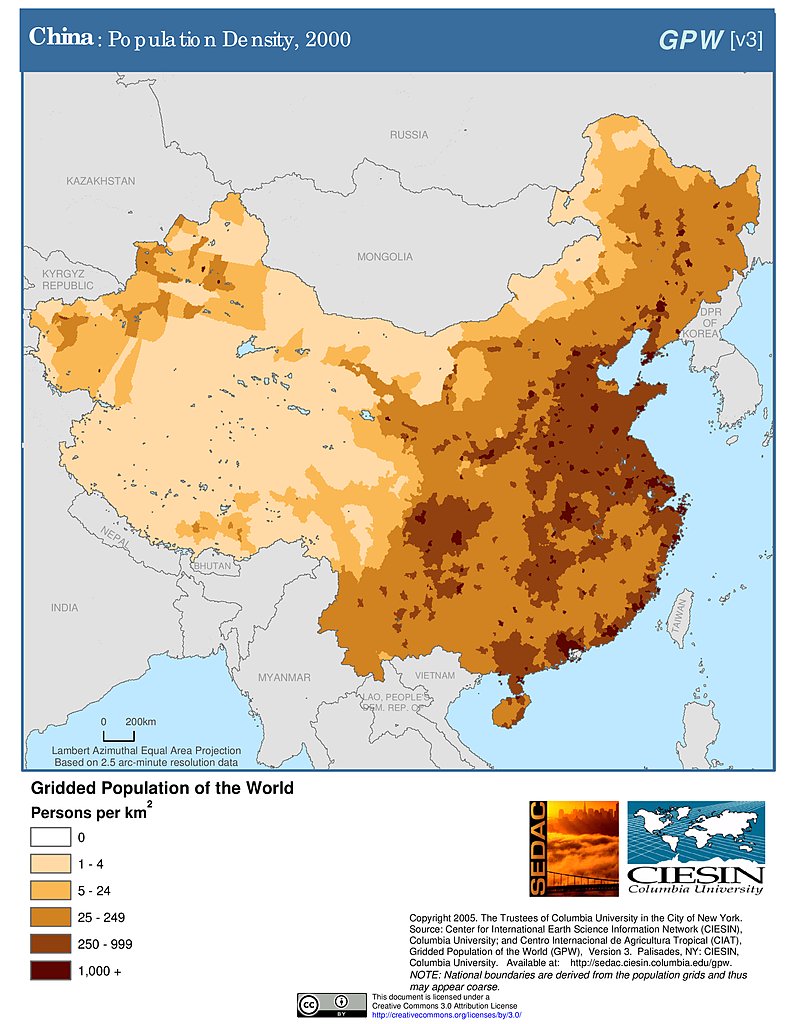
3. Below you can see maps of three different countries. Explain why their populations are unevenly distributed. Mention both human and physical factors.
- Malta
- China
- Egypt
|
|
|

2. WORLD POPULATION GROWTH
|
🡺 I can consolidate the meaning of birth-rate, death-rate and natural increase.
🡺 I can calculate the natural increase by means of given data of birth and death rate. 🡺 I can interpret and construct line graphs of population growth throughout given years. Population change depends on the birth rate, death rate and migration.
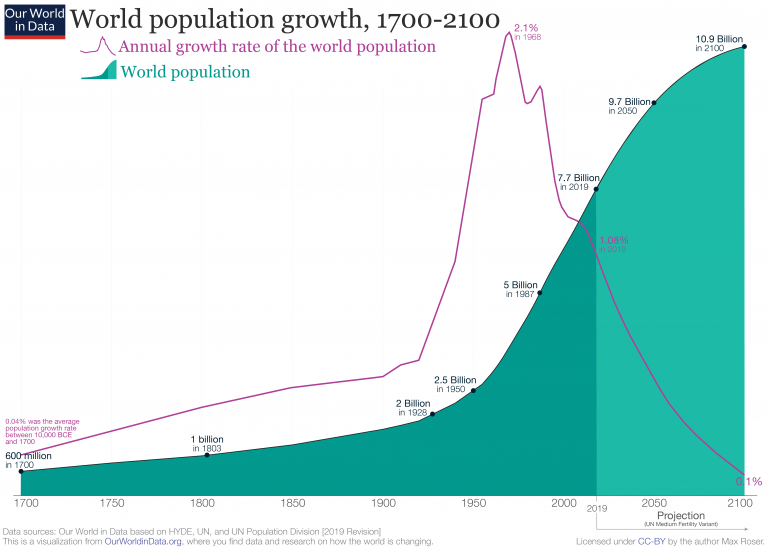
When birth rate is higher than death rate =>> Natural increase When death rate is higher than birth rate =>> Natural decrease Through history, populations have increased for the most part. Sometimes populations also decreased. This usually happens during times of war, disease, famine or drought. The growth rate of the world’s population
Why is the annual growth rate slowing down?
|
|
Geo-check!
|
1. Using this website http://www.poodwaddle.com/worldclock/ write down the population change in an hour.
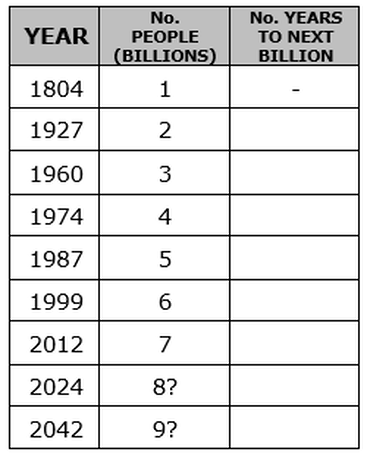
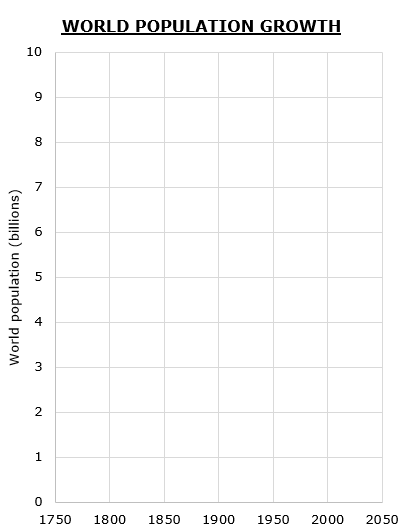
2. The data here shows the years the world population has increased by a billion. a. Plot the 1st and 2nd column on the graph above. b. Fill in the third column by calculating how much time it took to get to the next billion. c. Why did it take so long for the world to reach THREE billion? d. What do you notice about the time it is taking to reach the next billion? e. Do you agree with the 2024 and 2042 estimates? Why / why not? |
|
|
|
3. Write down THREE times there was a natural increase and a natural decrease.
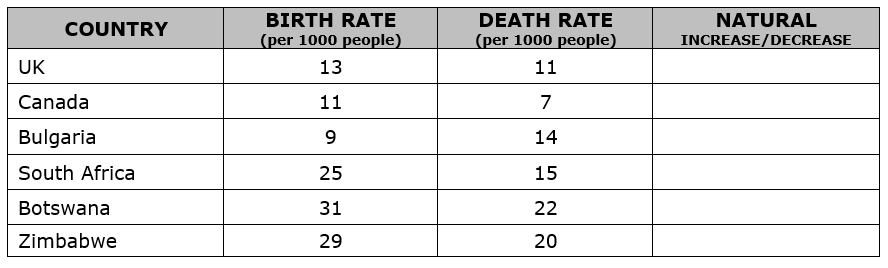
4. The statistics below show six countries at different development rates a. Fill in the fourth column with the natural increase of decrease. b. What do you notice about the birth rates between LEDCs and MEDCs? c. What do you notice about the death rates between LEDCs and MEDCs? d. Which country has the largest rate of natural increase? Why? |
|

3. POPULATION GROWTH IN LEDCS
|
🡺 I can identify faster population growth in LEDCs.
Here are some points about the world’s population
This map shows the size of the country by its population. You can see the date at the top. Notice how now, most people live in Asia and African and by 2100 most people will be in Africa.
|
|
|
|
|
Geo-check!
|
1. The map here is taken from http://www.visualcapitalist.com/fastest-growing-cities/. It shows the world’s fastest growing cities.
a. What do you notice about the distribution of the world’s fastest growing cities? b. Why is this happening? c. What do you notice about the cities which are slowly decreasing in size? |
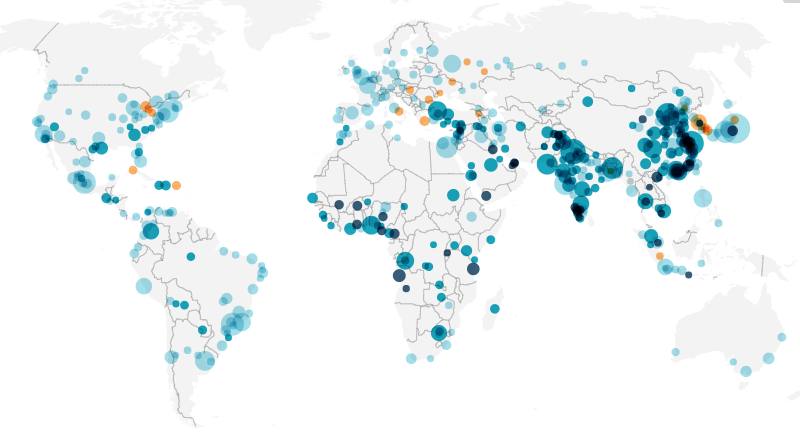
The darker blue circles show large population growth. Orange shows negative population growth.
Click on the image to zoom into the map!
|
|
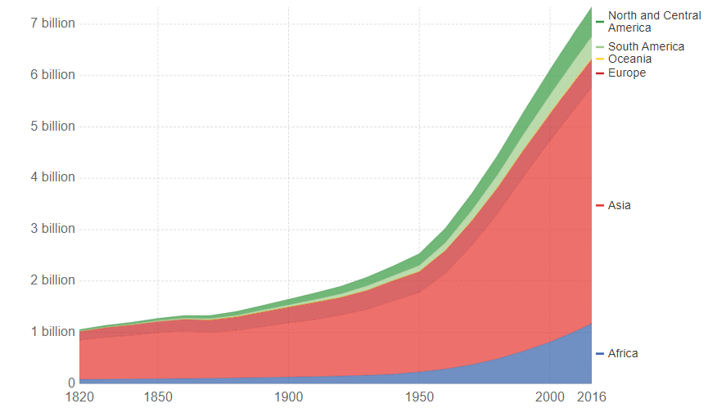
2. The graph below shows the world population divided into its different continents.
a. Rank the continents in order of population size in 2016. b. What is common about the population change in every continent? c. Why is there a sharp increase in the world’s population around the 1960s? d. Why isn’t this increase in the 1960s clear in Africa? |
|

4. THE DEMOGRAPHIC TRANSITION MODEL
|
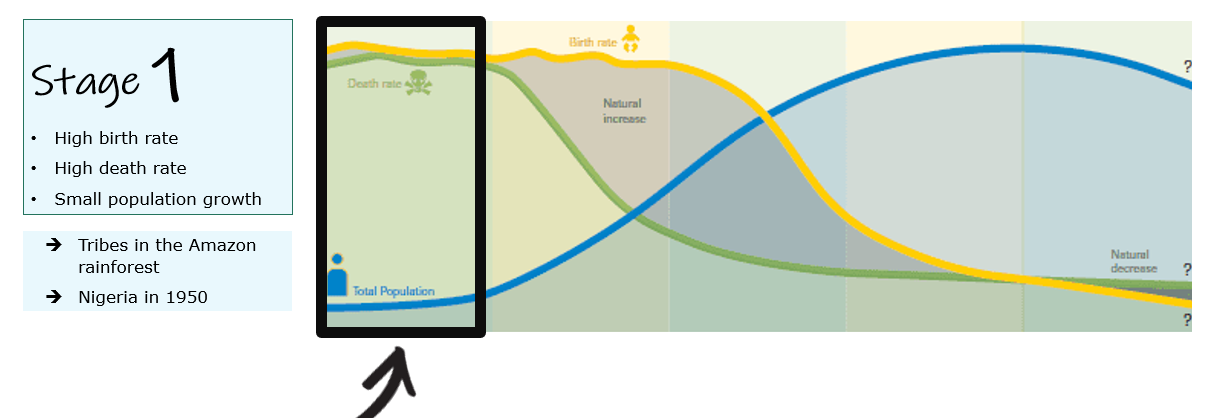
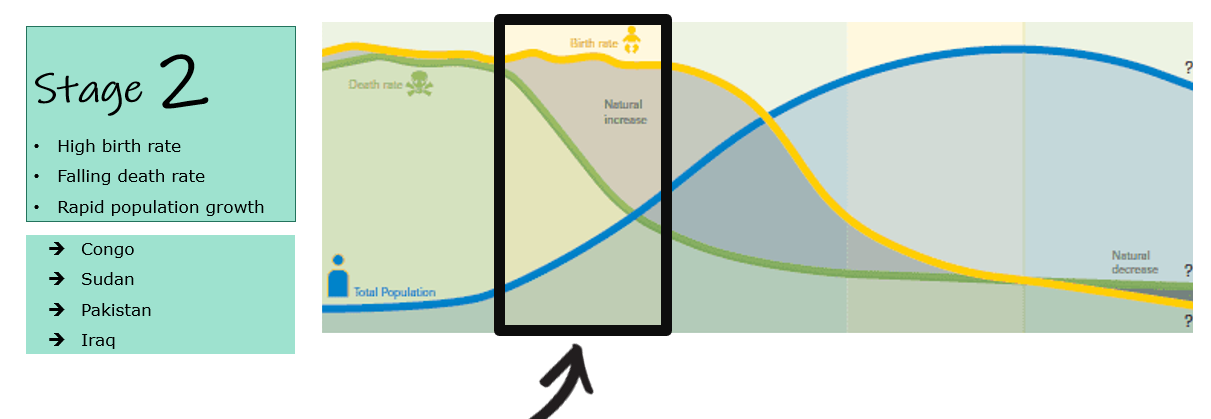
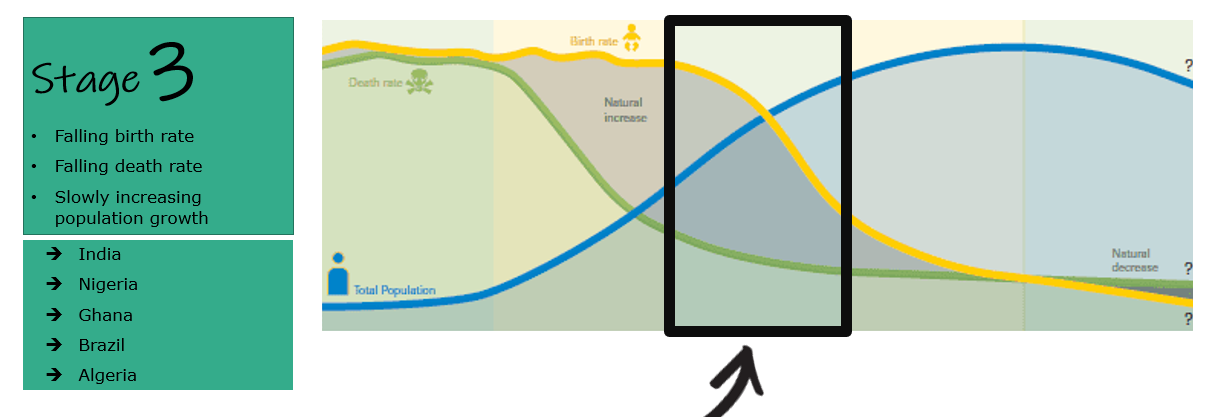
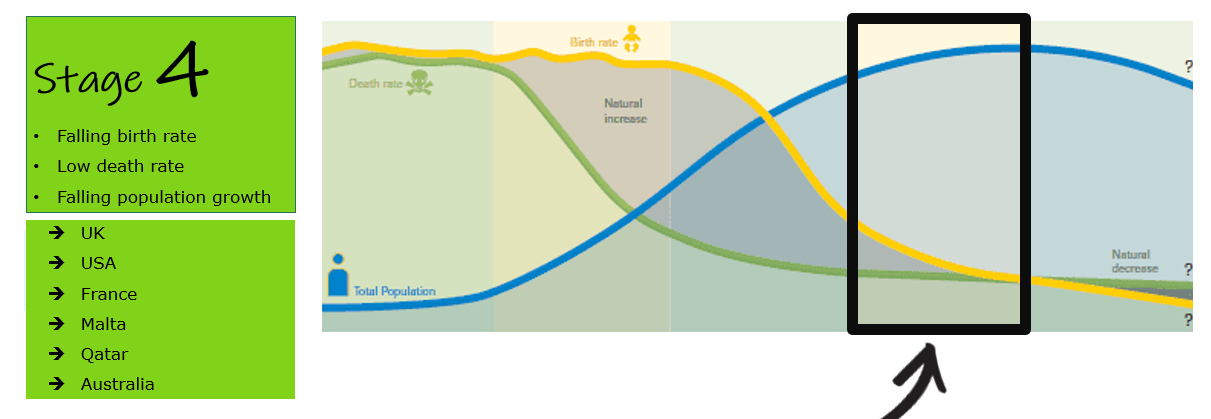
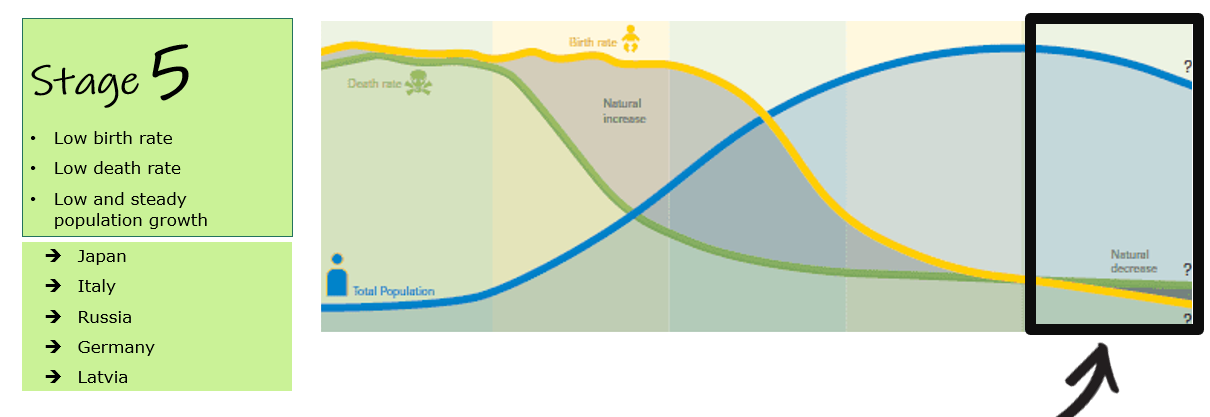
🡺 I can interpret a demographic transition model showing the four (and possibly the fifth) stages of population development.
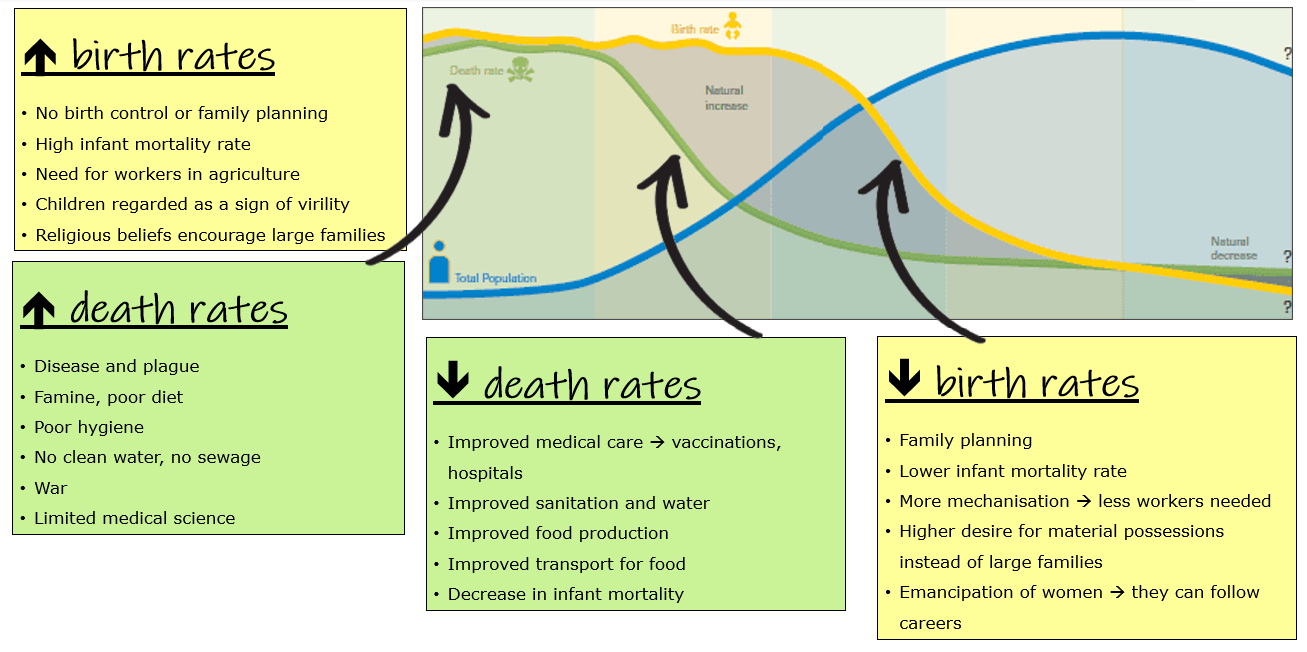
🡺 I can analyse the reasons in the fluctuations of the birth and death rates in the different stages of the demographic transition model. 🡺 I can apply the different stages to particular countries. What is the DTM?
Birth rates are high because:
High death rates because:
Fall in death rates due to:
Fall in birth rates due to:
Limitations of the DTM
|
|
Geo-check!
|
1. Fill in the table here for each stage of the DTM.
|

|

5. POPULATION STRUCTURE
|
🡺 I can interpret a population pyramid (age – sex structure graph) including gender, five year age groups as percentage of total population, and subdivision into the following broad age groups: young dependants (0 to 14); economically active (15 to 64); elderly dependants (65+).
🡺 I can compare the different shapes of population pyramids according to the stages of the demographic transition model. Population structure means the 'make up' or composition of a population. Looking at the population structure of a place shows how the population is divided up between males and females of different age groups. Population structure is usually shown using a population pyramid. A population pyramid can be drawn up for any area, from a whole continent or country to an individual town, city or village. The shape of a population pyramid can tell us a lot about an area's population. It gives us information about birth and death rates as well as life expectancy. A population pyramid tells us how many dependants there are. There are two groups of dependents;
Dependents rely upon the economically active for economic support. Dependency Ratio Many LEDCs have a high number of young dependents, whilst many MEDCs have a growing number of elderly dependents. Similar to the DTM, population pyramids can be seen for each of the 4 stages. This can be seen on the next page. |

How to read a population pyramid
Population pyramids and the dependency ratio
Population pyramids and the DTM
|
|
|
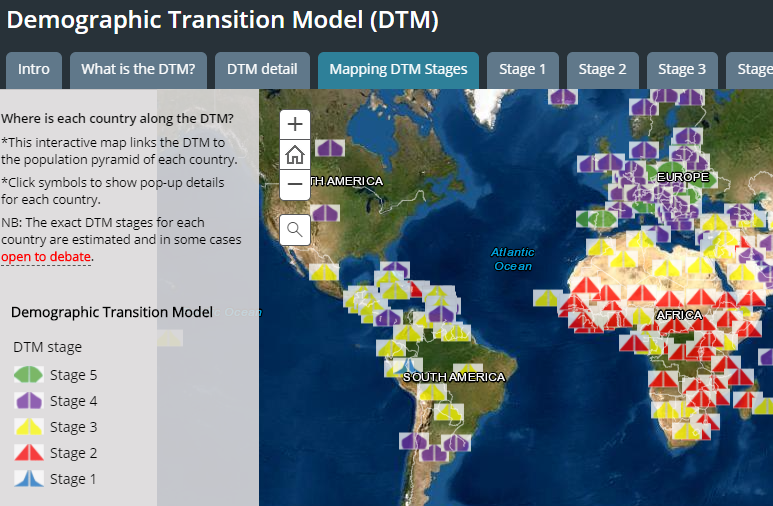
Click on the image above to see all the countries in the world, their stage in the DTM and their most recent population pyramid.
|
Geo-check!
|
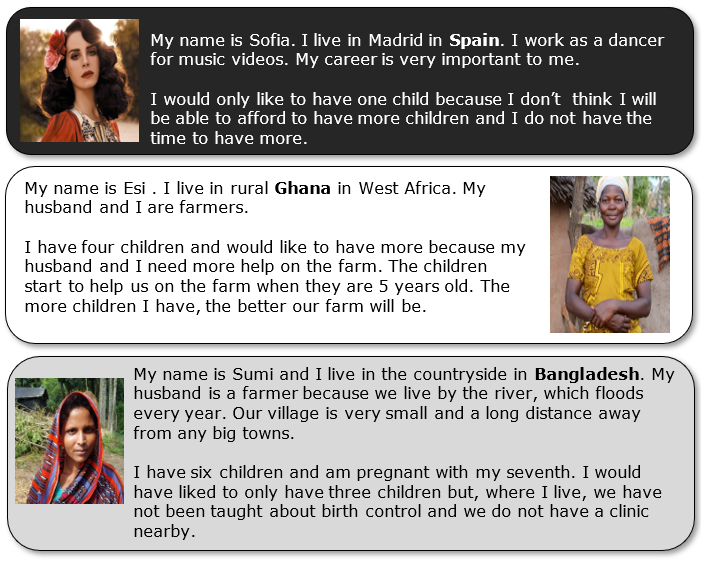
1. Read these women’s stories and answer the questions below.
a. Which of these countries do you think have a:
b. Place the countries in order of economic development and explain why you have chosen this order.
c. Explain why you have chosen this order. d. What problems do you think each of the countries may have if most of the women there have these opinions?
e. Some countries have a high birth rate but their population is falling. What factors might be causing this? f. The two population pyramids show the countries of Bangladesh and Spain. Which country do you think is each one? Explain why. |
|
|
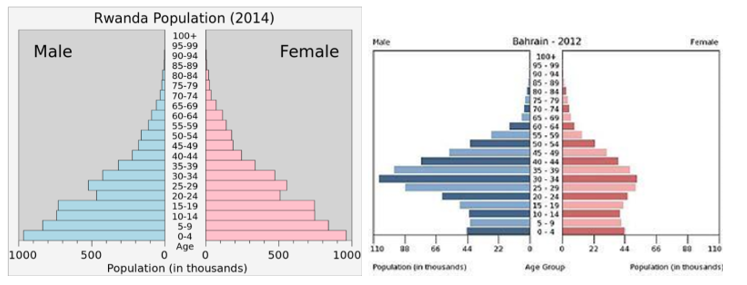
2. Study these TWO population pyramids. Look up both countries on the internet.
a. Both of the pyramids have anomalies. What are they? b. Why is there suddenly a drop in the overall population in Rwanda? c. Why there are significantly more males in Bahrain than females? d. Can you think of FOUR other factors that may affect population? |
|

6. CHANGING STRUCTURES
🡺 I can apply the different types of pyramids to LEDCs and MEDCs.
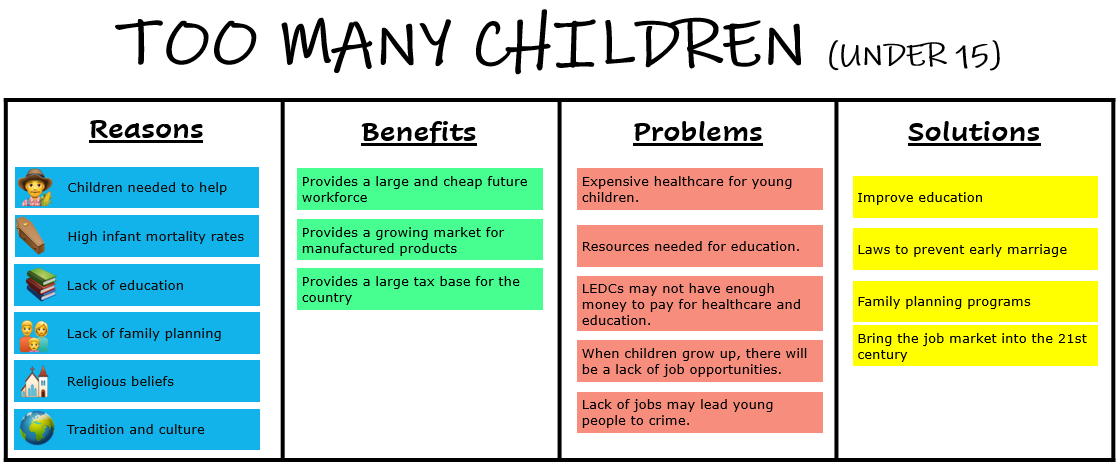
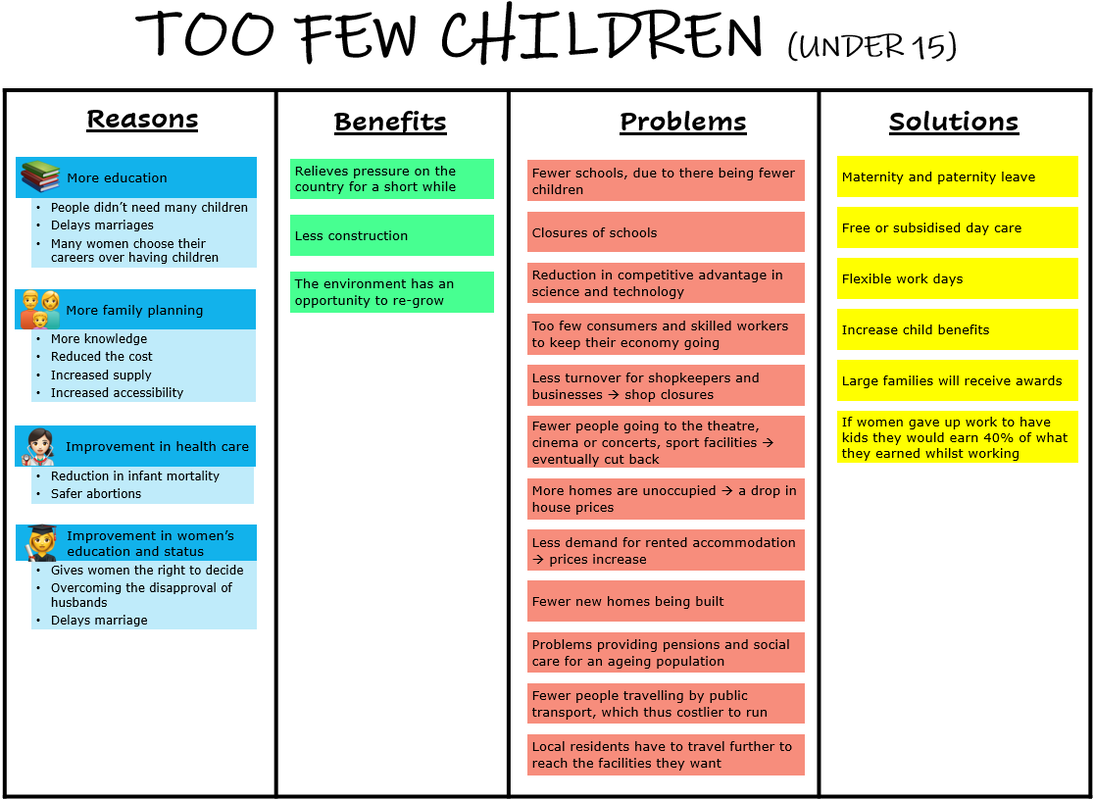
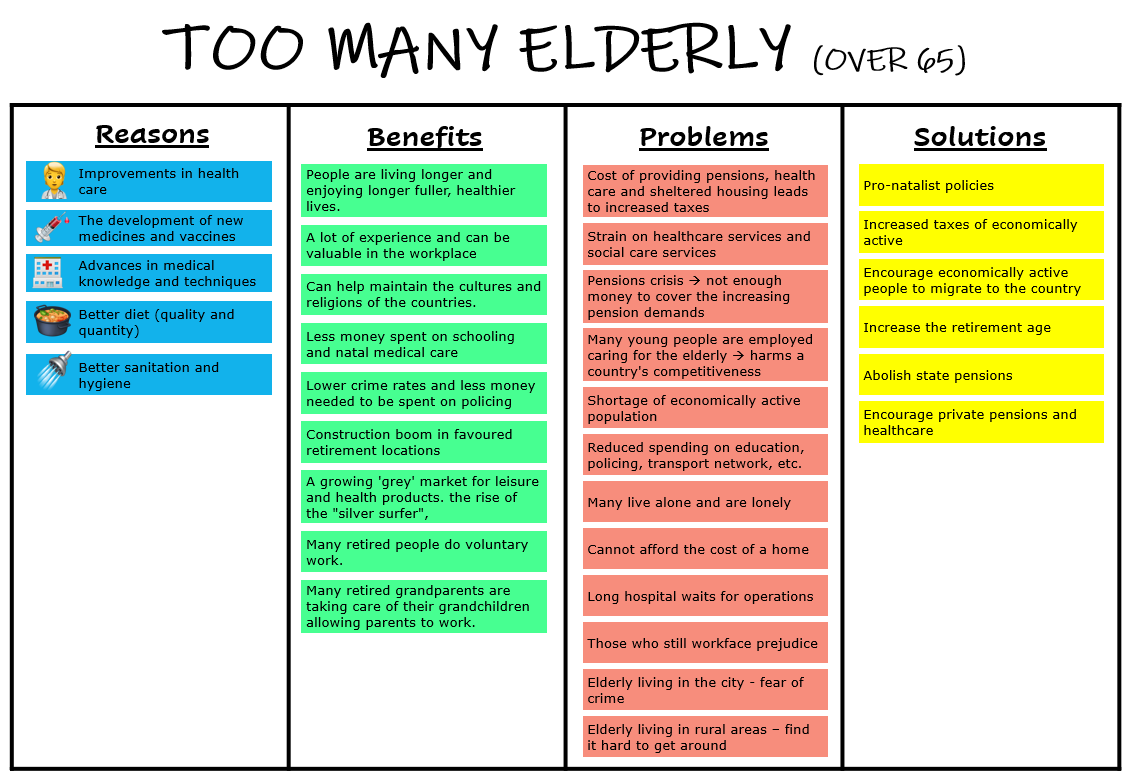
Populations can have too many or too few children, or too many elderly people.
Below, you can see a list of:
Populations can have too many or too few children, or too many elderly people.
Below, you can see a list of:
- reasons why this happens
- benefits of the situation
- problems of the situation
- solutions to the situation.
|
|
|
Geo-check!
|
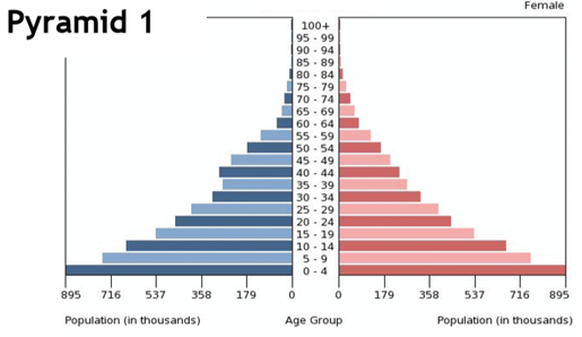
1. Answer the questions based on Pyramid 1.
a. Look at the pyramid above. Circle the correct answer.
b. Which stage of the DTM does this country belong in? Why? c. Give FOUR reasons for the shape of this pyramid. d. Give THREE problems this country has at the moment. |
|
|
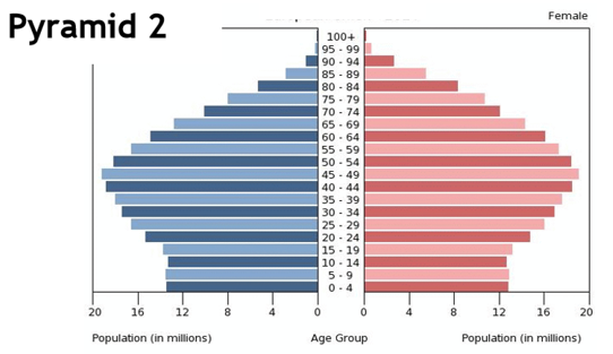
2. Answer the questions based on Pyramid 2.
a. Look at the pyramid above. Circle the correct answer.
b. Which stage of the DTM does this country belong in? Why? c. Give FOUR reasons for the shape of this pyramid. d. Give THREE problems this country has at the moment. |
|

7. CASE STUDY: BRAZIL DENSITY AND DISTRIBUTION
|
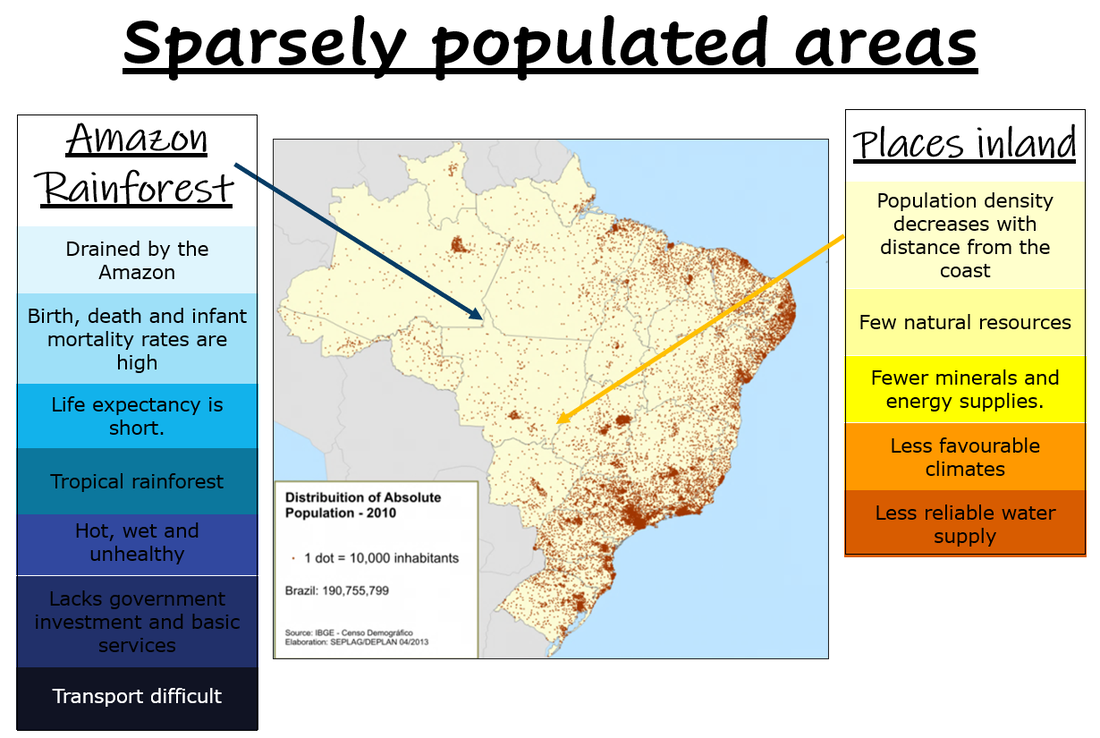
🡺 I can identify low and high densities on a map of Brazil.
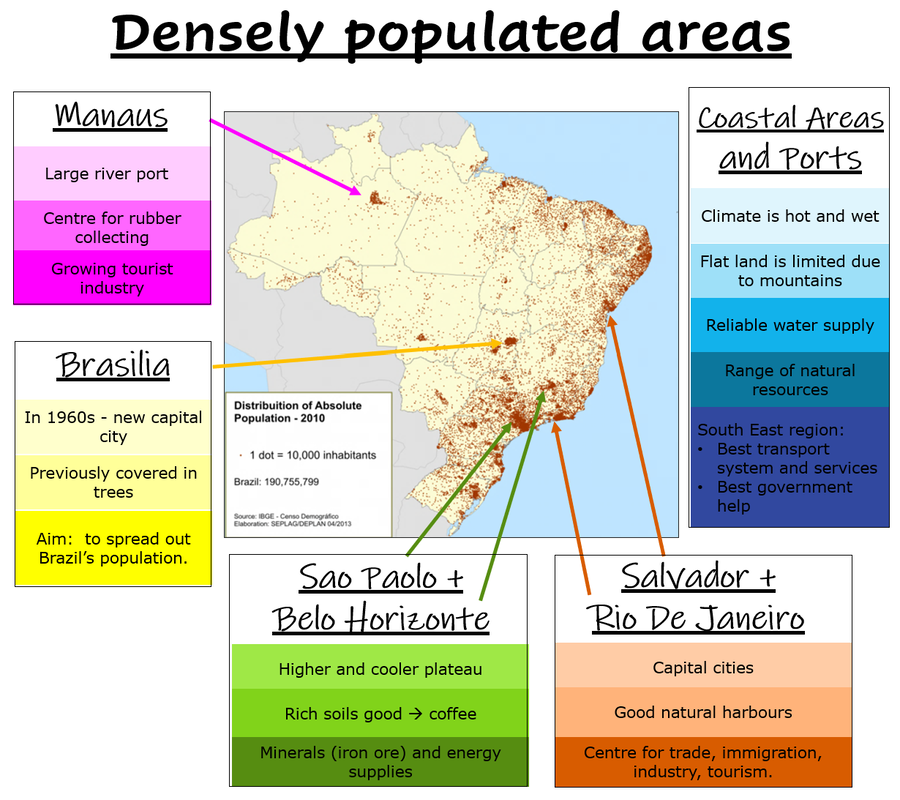
🡺 I can analyse the reasons for such distribution of population. 🡺 In 2008 the average population density was 22.9 people per km2 🡺 Over 90% of Brazilians live near the coast 🡺 Going inwards, the density decreases rapidly. 🡺 Highest population densities are at irregular intervals along the coast SALVADOR AND RIO DE JANEIRO
SAO PAULO AND BELO HORIZONTE
BRASILIA
MANAUS
NORTH WEST/AMAZON
PLACES INLAND
|
|
|
|
|
Geo-check!
|
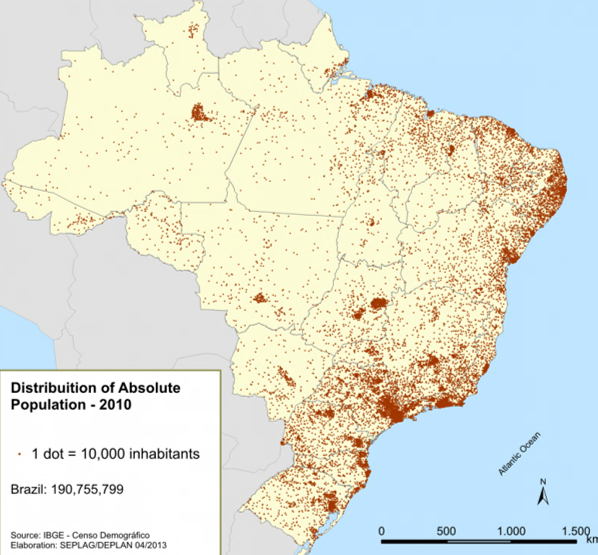
1. This is a dot map of Brazil.
a. The countries here surround Brazil. Mark them on the map:
b. Mark these cities in Brazil:
2. Describe the general population distribution of Brazil. Explain why the south-eastern part of Brazil is densely populated and the north-western part is sparsely populated. |
|

8. CASE STUDY: CHINA: CONTROLLING POPULATION GROWTH
|
🡺 I know the reasons for China's one-child population policy.
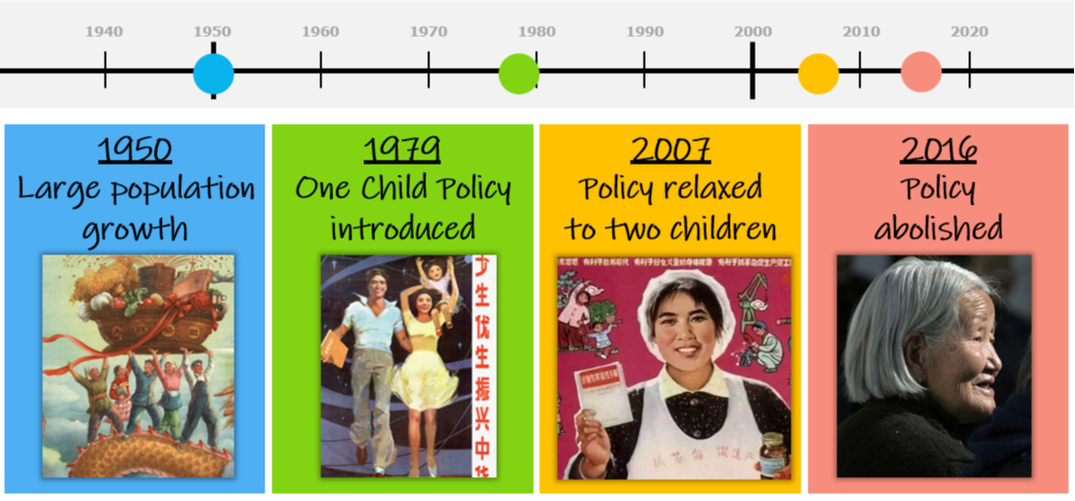
🡺 I am able to explain the above named policy. 🡺 I can analyse the outcomes and modifications to the same policy. Mid twentieth century
One child policy
Exceptions to the one child policy
Since the policy
Relaxations in the policy
|
|
|
|
|
|
|
|
|
|
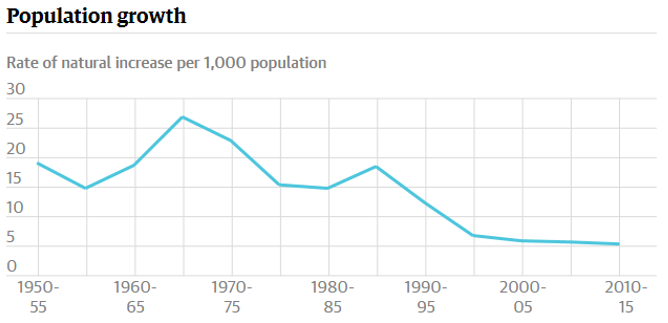
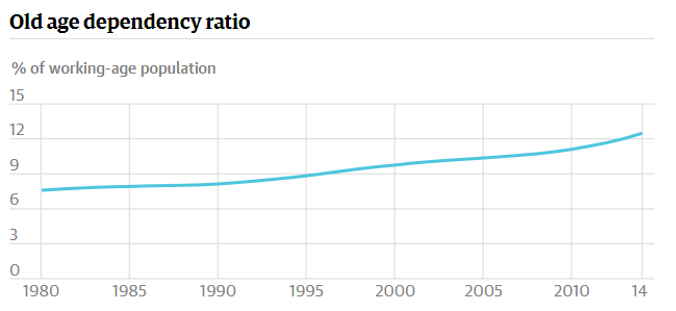
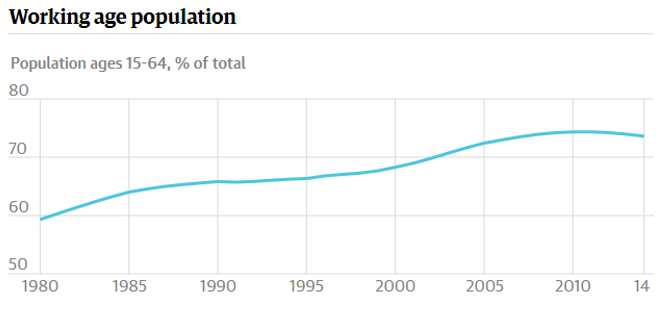
1. The following graphs show the statistics during China’s One Child Policy. Write notes on each of the graphs.
|
|
|
Geo-check!
2. Using the three articles here, answer these questions.
a. For how many years did the one child policy work?
b. How many children did people on average used to have before the policy?
c. Who lead china from 1949 until his death in 1976?
d. Why did he want such a large population?
e. On what date was the introduction of the policy introduced?
f. How many births does the government believe they have prevented?
g. What county has been experimenting with a two-child policy?
h. What country has the largest population in the world?
i. What is one of the main problems China now faces?
j. Apart from the aging population what is another daunting prospect, especially for men?
|
ARTICLE 1
During the time that I grew up in China in the 1960s and 70s, Chinese families could have as many children as they liked. Many had four or five children. Some even had six or seven. My parents had four children. After the government started enforcing the rule of one child per family - often forcibly - my parents would sometimes jokingly remind me that I was an "exceeded quota person", meaning that under the one-child policy I would not have existed. Chairman Mao, who led China from 1949 until his death in 1976, regarded a fast-growing population as a productive force necessary for China to become a great power. He treated brutally those who dared to question him and believed that China should control its population. His successor Deng Xiaoping started to reverse the trend. He felt the tremendous drag China's huge population had on its fragile economic recovery after years of political trouble. The first children born under the one-child policy face the prospect of caring for an ever-increasing number of pensioners” On 25 September 1980 the Communist Party issued an "open letter" to all members of the party and the Communist youth league, urging them to take the lead in having only one child. This is widely seen as the beginning of the controversial one-child policy. The government claims that the policy has helped the country achieve 400 million fewer births during the past 30 years. But this has come at a painful cost - keenly felt by my generation and those after us. One of my childhood friends, who didn't want to reveal his name, has had to let his daughter, his second child, call him uncle in order to escape punishment for breaking the rule. He says it breaks his heart every time he talks about his daughter, who is officially registered as someone else's child. A female friend, like countless other young couples in China, had to pay a large fine for having a second child. But she believed the money was worth it. Falling fertility Officials have repeatedly stressed that the policy has helped reduce the pressure of population growth on society and economic development, will continue. But the government has already been challenged over whether the 400 million fewer births were entirely due to the implementation of this policy. China faces the looming problem of a rapidly ageing society with not enough young carers. The debate over whether the one-child policy is still needed was recently stirred up by a newspaper report about the little publicised case of Yicheng county, in the northern province of Shanxi. Yicheng has been experimenting with a two-child policy for 25 years. Despite its more relaxed regulations, the county has a lower than average population growth rate, the report said. After three decades, the drawbacks of the one-child policy are more and more apparent. Even though China still has the largest population in the world, a report last month by the Chinese Academy of Social Sciences, said officials were seriously overestimating the fertility rate.Instead of suppressing it, the report said the government should try to lift it. More and more people in China, largely in urban areas, prefer to have fewer children. It is unclear when Beijing might end the one-child policy. But attention will be focused on an upcoming meeting of the party central committee next month. Clearly, the situation is becoming urgent. Already the country's population is ageing fast. The first children born under the one-child policy face the prospect of caring for an ever-increasing number of pensioners. China also faces the daunting prospect of many men who can't find wives as many female foetuses have been aborted, resulting in a huge gender imbalance. |
ARTICLE 2
WEI - AN ONLY CHILD Hi my name is Yang Wei. Yang is my surname. I am 14 years old and at middle school in Shanghai. I have no brothers and sisters. In fact, everyone in my class is an only child. My mum says she’d have more children, but we must put China first. So, what’s it like for us, being only children? Our parents do everything for us. They try to give us everything we want. If I had brothers and sisters I would not get so much attention. But it’s bad in other ways. When your parents have only you to think about, they put too much pressure on you, especially about school. I have to study all the time. And not just pass exams, but do really well. I got 76% in a maths test last term and they stopped my pocket money for a whole month! All they want is for me to get into a good high school and then university and get a good job. It’s the same for everyone in the class. Some of us study for 14 hours a day, between class and homework. I even work in the morning, before school. And my parents hate me to hang around with people who they think don’t work hard. There could be problems in the future too. When I get married, my wife and I will have to look after our child and also help our four parents. Maybe even our grandparents, because they get only small pensions. It could be a big burden. So we’ll need jobs that pay well. Still, the policy may have changed by then. Or I might start a business and get rich. Then I might have more than one child – because fines would not bother me. |
ARTICLE 3
JU - A FARMER I’m Tong Ju. My husband and I are rice farmers here in Yunnan province. We already had two daughters when the One Child policy came along. Of course we love them. But here in China people think it is better to have a son because when a daughter marries, she can’t really help you. You lose her to her husband’s family. Then I found out I was pregnant again. The village committee called me in and gave me a hard time. Then our son Jian was born. We were so happy. We had to pay a big fine, but it was worth it. Now our daughters are married in the next village, but our son went off to Ghuangzhou, because people earn more money in the city. It can be hard for country people in the city, because they do not have a resident’s permit, but Jian is smart and works hard. He got a temporary permit, and has a good job in a factory. They made him a supervisor. Jian got married 2 years ago, to Ting. Now they have a son. They work long hours so they brought the baby to us to look after. Jian sends money every month and they come and visit for a week at Chinese New Year. I do worry about the future. We don’t have much money saved. There are no old-age pensions in this district yet. We do not want to be a burden on our son. Still, as my husband says, worrying never mended anything. |

3. Using two different colours shade the boxes below highlighting for and against China’s One Child Policy. Remember to include a key at the bottom of the page.
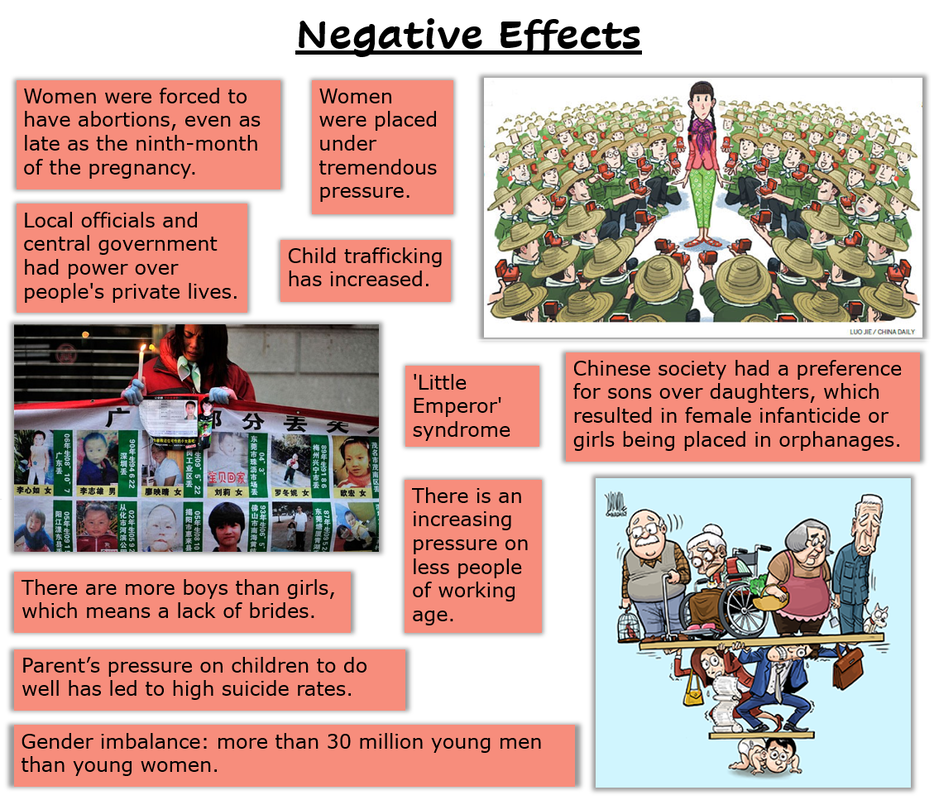
- More money and attention are given to the only child by parents and grandparents leading to a rise in obesity and a generation of ‘spoiled brats.’
- Parent’s pressure on children to do well has led to high suicide rates as children are either unable cope with the stress.
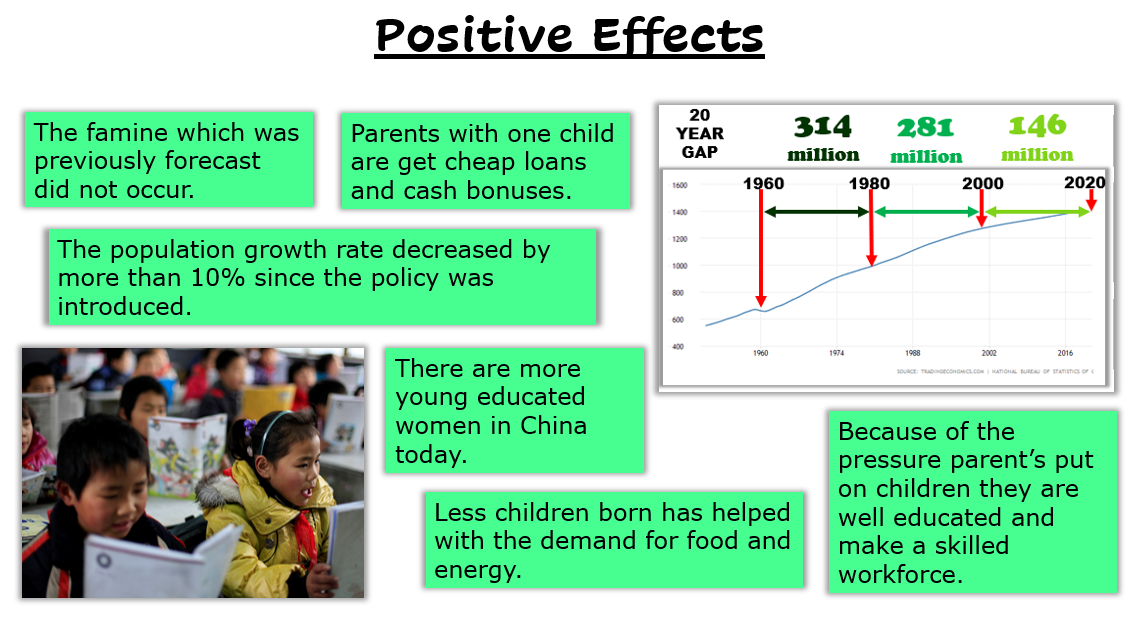
- There are more young educated women in China today
- Parents with one child are get cheap loans and cash bonuses.
- Child trafficking has gone up where families second born children are sent out of the country.
- Parents with extra children are fined and if they are unable to pay, their homes are taken from them.
- With the arrival of baby scans more female’s babies are aborted.
- There are more boys than girls, which means a lack of brides.
- Because of the pressure parent’s put on children they are well educated and make a skilled workforce.
- There is an increasing pressure on less people of working age as well as on government pensions.
- Boys will carry on the family name and are seen as an investment.
- There are more male babies being born.
- Less children born has helped with the demand for food and energy.
9. CASE STUDY: ITALY - AGEING POPULATION
|
🡺 I can summarise the problems created by the ageing population of Italy.
Between 1950 and 2008, life expectancy in Italy has increased from:
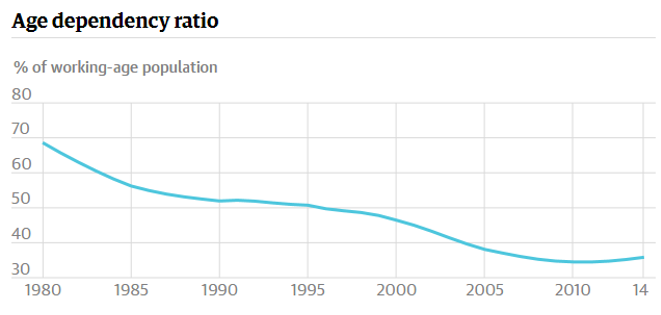
Now, 20% of the population is over 65 years old. This is expected to rise to 25% by 2050. The ratio of Italian pensioners is 0.7. This means that every Italian worker has to support his own family and another pensioner. In 2008, 21% of Italy’s GP was spent on the elderly. 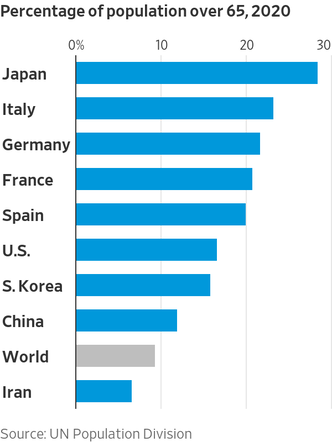
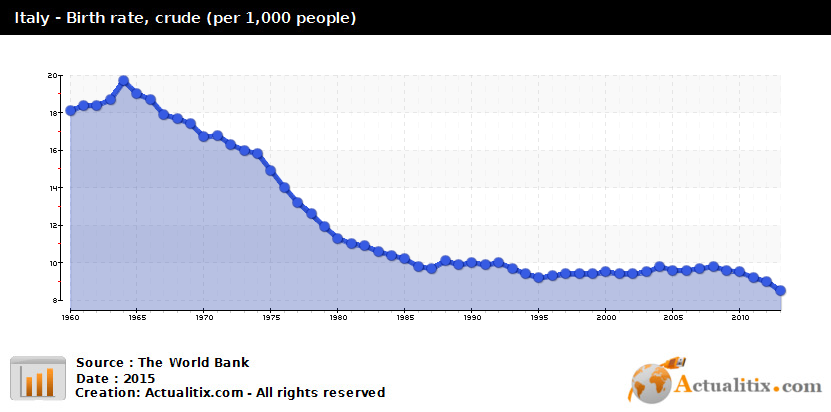
Look at the birth rate decreasing!
|
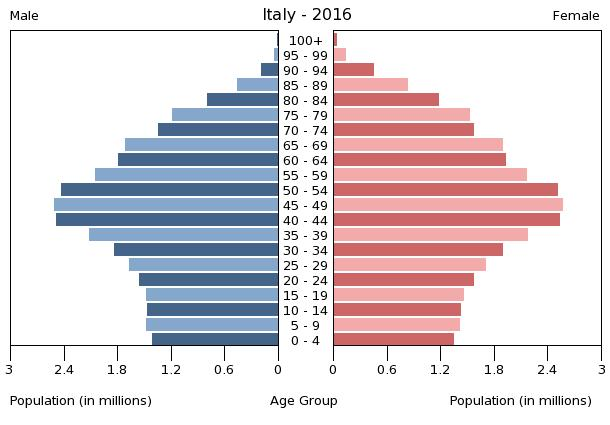
Population pyramid of Italy. Look at the large number of people over 65 years old. Look at how few children are being born every year.
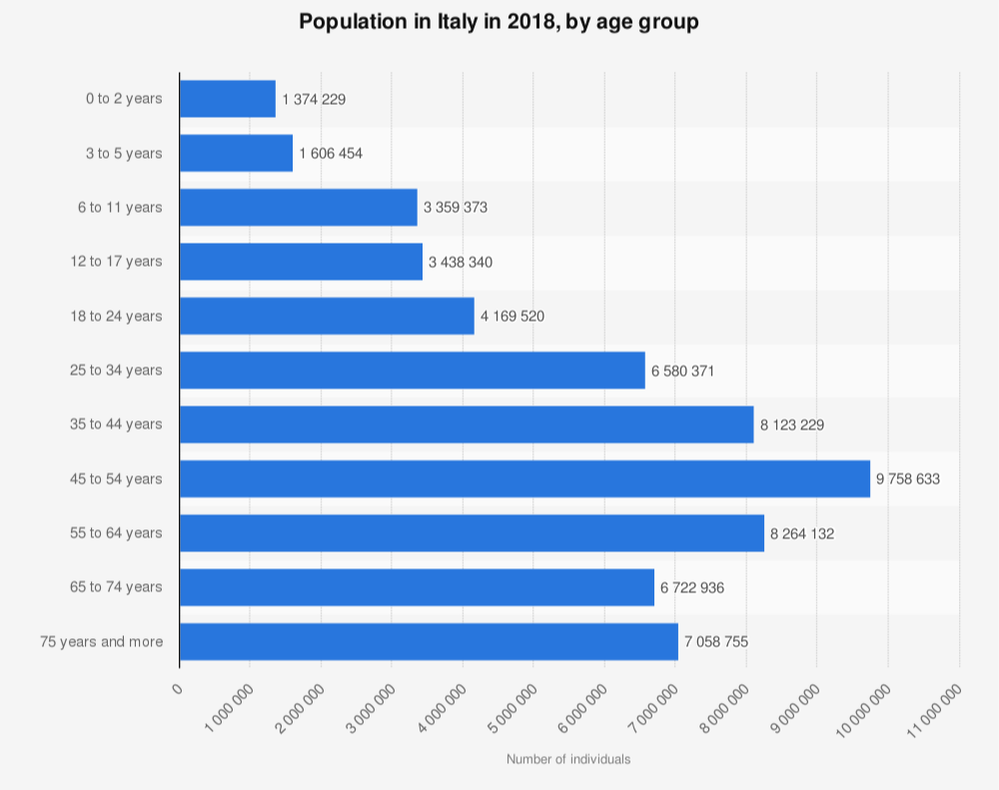
The largest age group is 45 to 54 years. That means that in 20 years time, the people in this age group will all be pensioners.
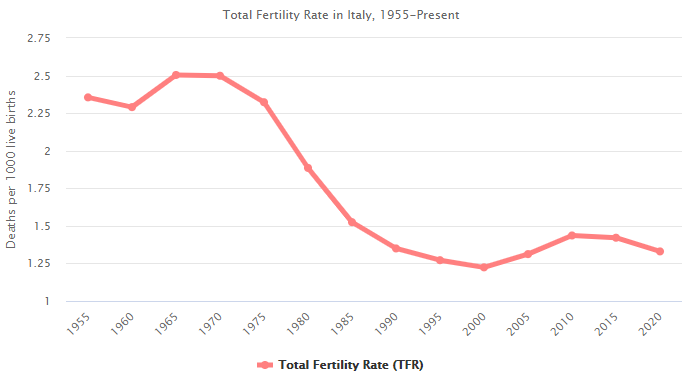
Fertility rate is the average number of children a woman will have in her lifetime. The population will continue to survive if the fertility rate is 2. Italy's fertility rate is 1.3.
|
Geo-check!
1. Answer these questions, about the Italian population
a. Name three problems and two benefits of an ageing population.
b. Suggest three reasons why the people of Italy are now able to live to an older age.
c. List two reasons why Italy’s population is ageing.
d. Make a list of some of the problems created by an increasing ageing population in Italy.
e. What solutions were put forward to try to solve the problem of an ageing population in Italy?
|
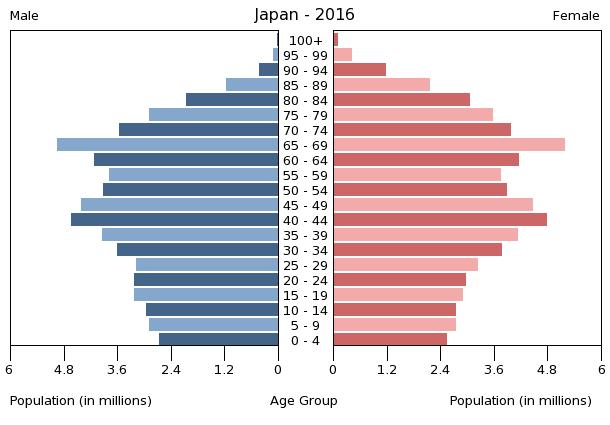
2. Japan also has an ageing population, like Italy.
a. Why do you think this man, who had never broken a law before in his life, end up in prison? b. Look at Japan’s population pyramid. Explain it, using the terms life expectancy, birth and death rates and dependency ratio. c. Write ONE tweet (140 characters) to the Japanese government explaining why their country is in trouble. (You can read the article on the right) d. Image you are the Yuki, sat in his prison cell. Write a diary entry explaining why you chose to go to prison and why you like it here. e. Write a tweet to the Japanese Government explaining how they can fix the problems caused by ageing. |
|