
NOTE: This is PART 1 of this unit.
PART 2 covers MIGRATION. These are lessons 6 - 9. |
Why do so many people live in India and so few live in Canada? Which countries are growing extremely fast? Why are European countries growing slowly? In Geography we love learning about people, and in this topic we're going to do just that! Let's start!
The lessons covered in PART 1 of this unit are: 1. Population density and distribution 2. Densely or sparsely populated areas 3. The world’s population 4. Fastest growing cities 5. Population increase and decrease |
1. POPULATION DENSITY AND DISTRIBUTION
|
🡺 I can explain the difference between population density and distribution.
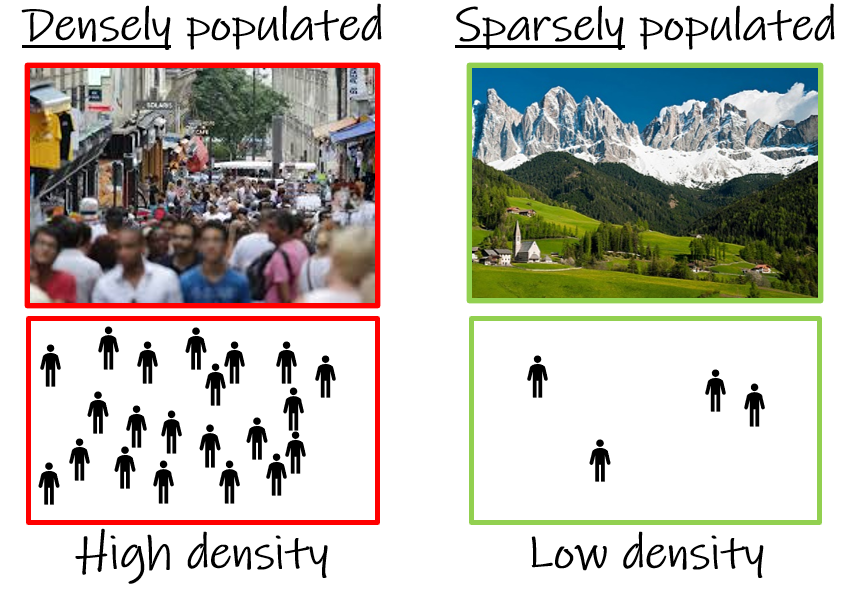
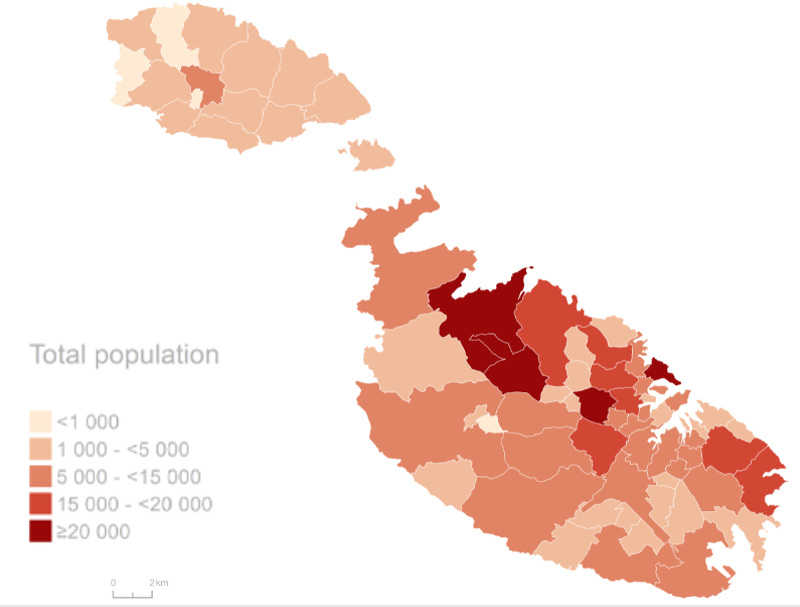
There are about 440,000 people living in Malta, but where do they all live? A population distribution map shows how people are spread across the country. You can easily see that the population is not evenly spread out. There are some areas with a lot of people and some with very few. The map uses density to show how crowded places are. Density is the number of people in an area. It is worked out by dividing the total population by the total area and is usually given as the number of people per square kilometre. Places that are crowded are said to be densely populated and have a high population density. Places with few people are said to be sparsely populated and have a low population density. The most crowded places of all are towns and cities. The photos here show places with very different population densities. The top photo shows a typical city scene with many buildings, plenty of activity and a lot of people. The bottom photo shows Tyrol, a beautiful area in northern Italy that is sparsely populated. |
|
Geo-check!
|
1. Think of different places around the world. Write down THREE places that are densely populated and THREE places that are sparsely populated.
2. Using the population distribution map of Malta, write a paragraph to describe the distribution of population in Malta. Include the following words: spread, unevenly, North, South, harbour area, Gozo, densely, sparsely. 3. This is a population density map of Italy. a. Describe which places are most densely populated? Circle them on the map. b. Give TWO reasons why you think these places are densely populated. c. Describe which places are most sparsely populated? Add a X on the map. d. Give TWO reasons why you think these places are densely populated. »» SOLVE IT! Find the population density for these countries (in the table). Circle the country with the highest. 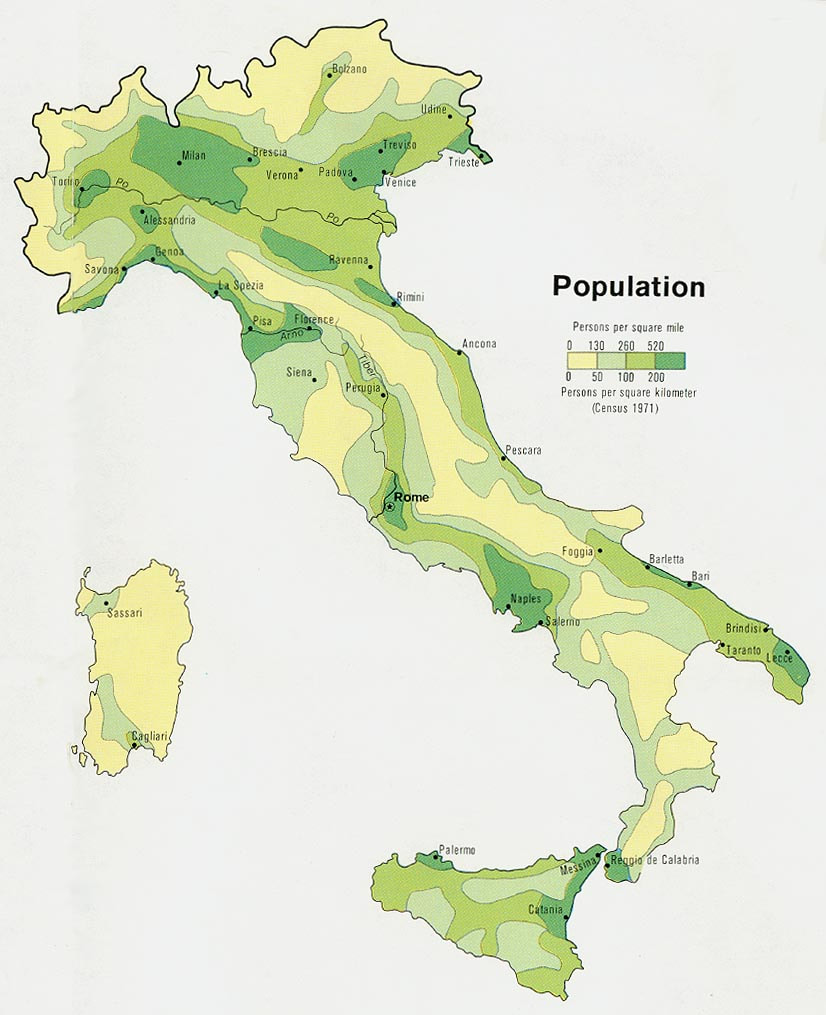
|
|
2. DENSELY OR SPARSELY POPULATED AREAS
|
🡺 I can mention places that are densely or sparsely populated and explain why areas are densely or sparely populated.
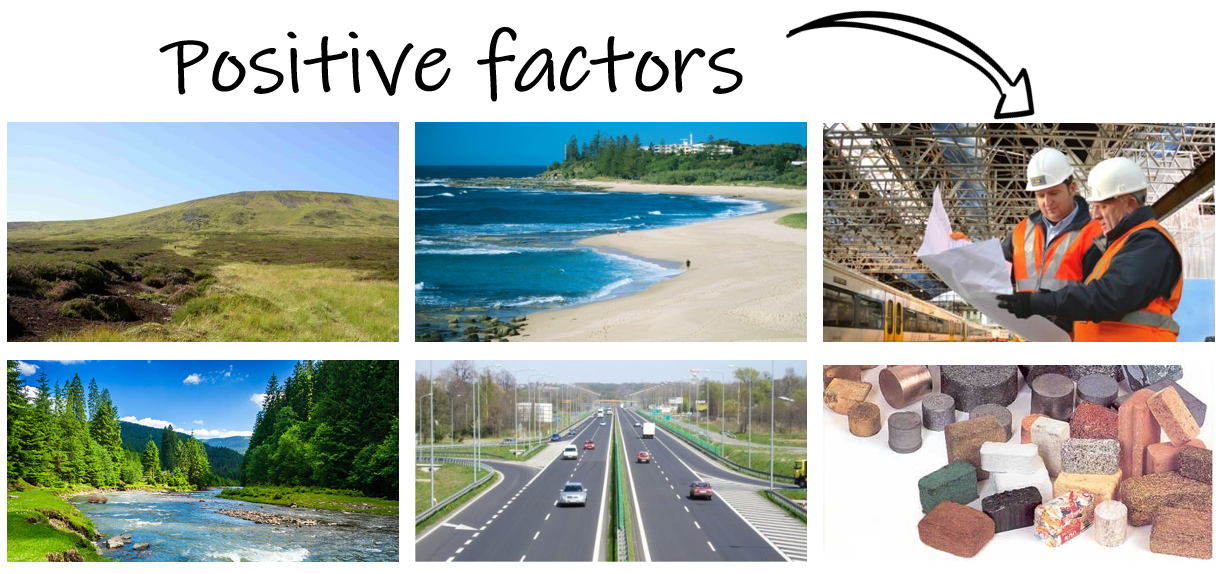
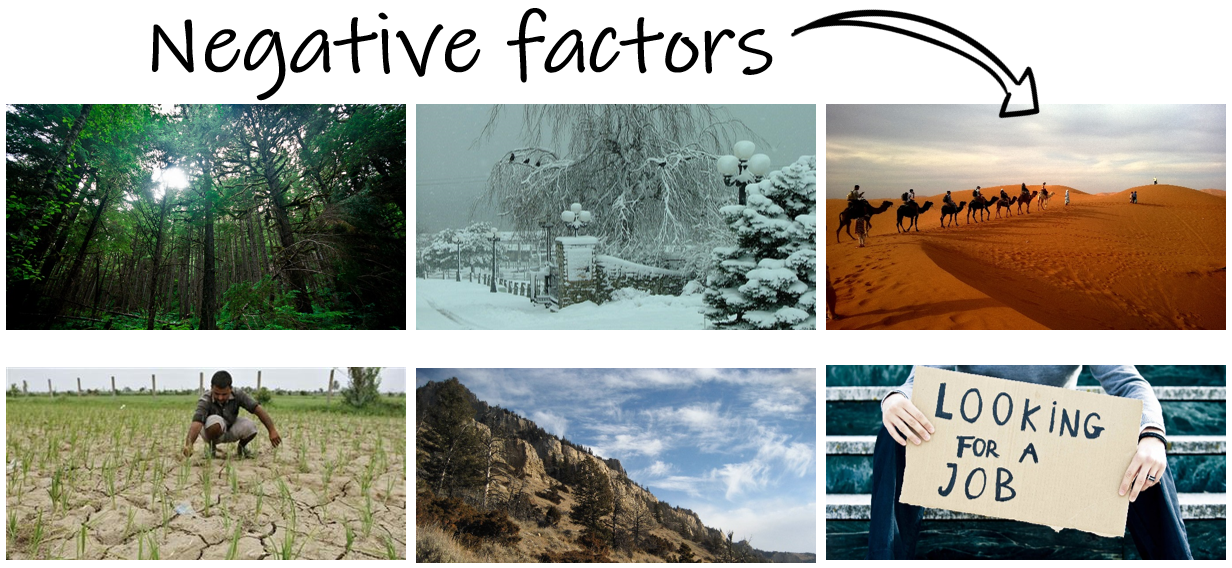
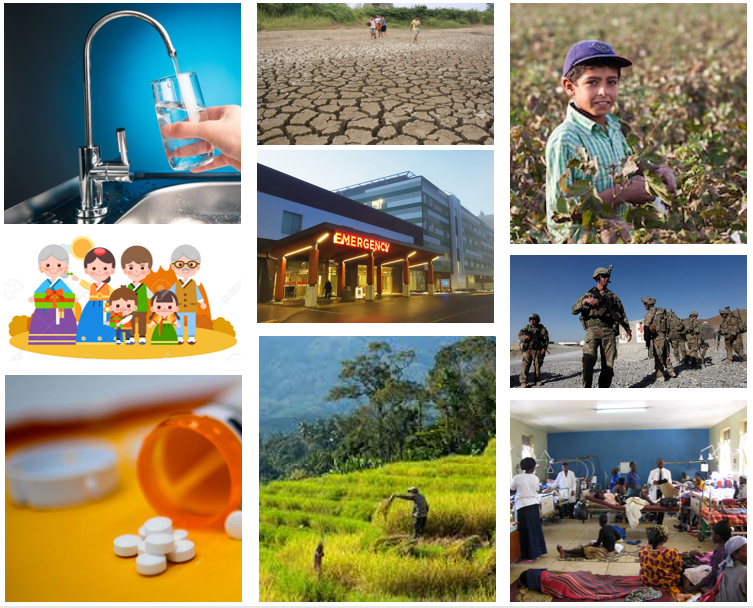
The population is uneven, not only in many countries, but throughout the world. There are now over 7 billion people living in the world, yet most of them live on only a third of the land surface. Some areas are very crowded, and others are almost empty. There are many reasons for this. People do not like to live in places which are too hot or too cold. Nor do they like places that are mountainous, lack vegetation are densely forests or liable to flood. People prefer pleasant places in which to live. They want to be able to earn money and have food available through farming or from shops. They like to be near to other people and have things to do and places to go. Factors that discourage people from settling in an area are called negative factors. Factors that encourage people from settling in an area are called positive factors. POSITIVE FACTORS
NEGATIVE FACTORS
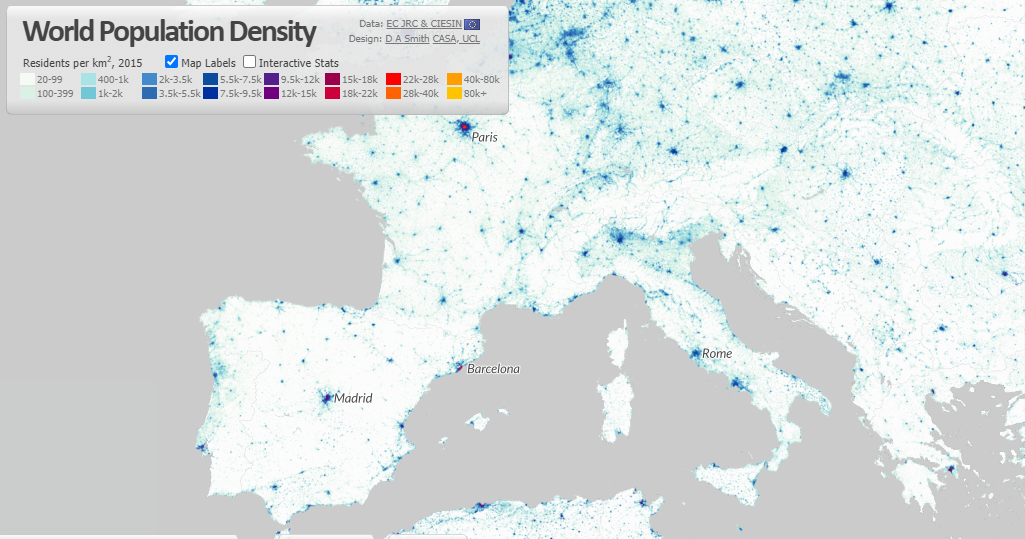
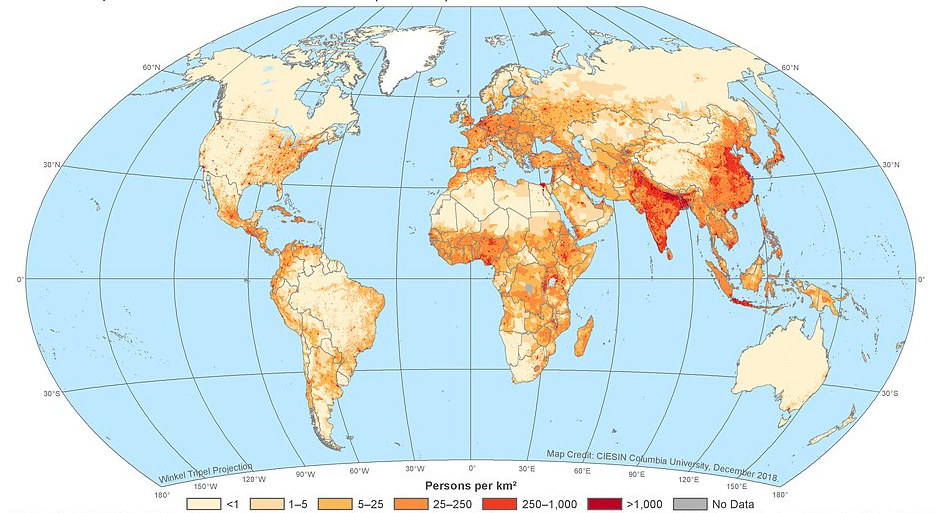
Click on the image above to see where people live in the world. Zoom into your own country and look at how people are spread out!
|
|
Geo-check!
|
1. Write down FIVE positive and FIVE negative factors.
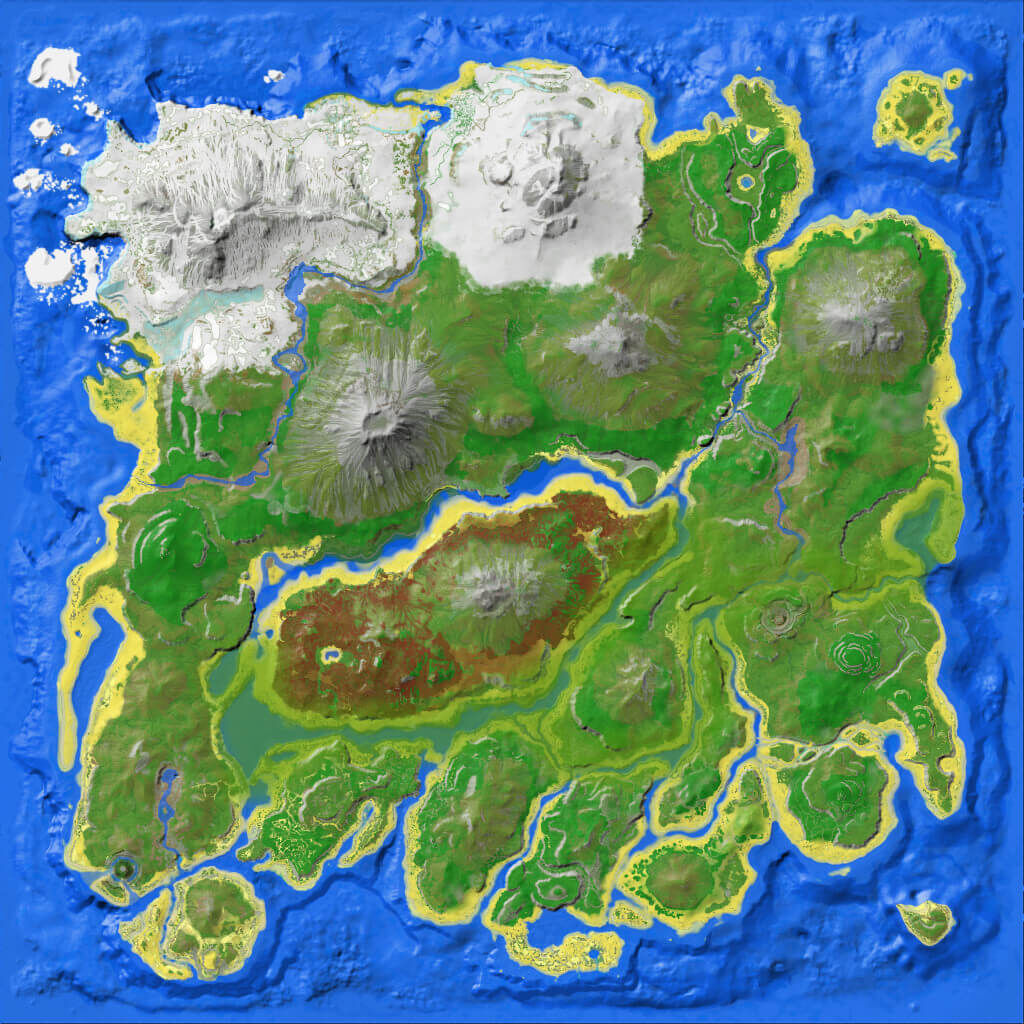
2. Look at the map of Survival Island here. a. Mark a place on the map where you would live with an X. List and explain TWO reasons you would live there. b. List and explain ONE negative factor about living here. c. Circle a place on the map where you would NOT live. Explain why you wouldn’t live there. CHALLENGE! What do you think is the most important positive factor? Why? |
|
3. THE WORLD’S POPULATION
|
🡺 I understand that the world’s population is growing at a very fast rate.
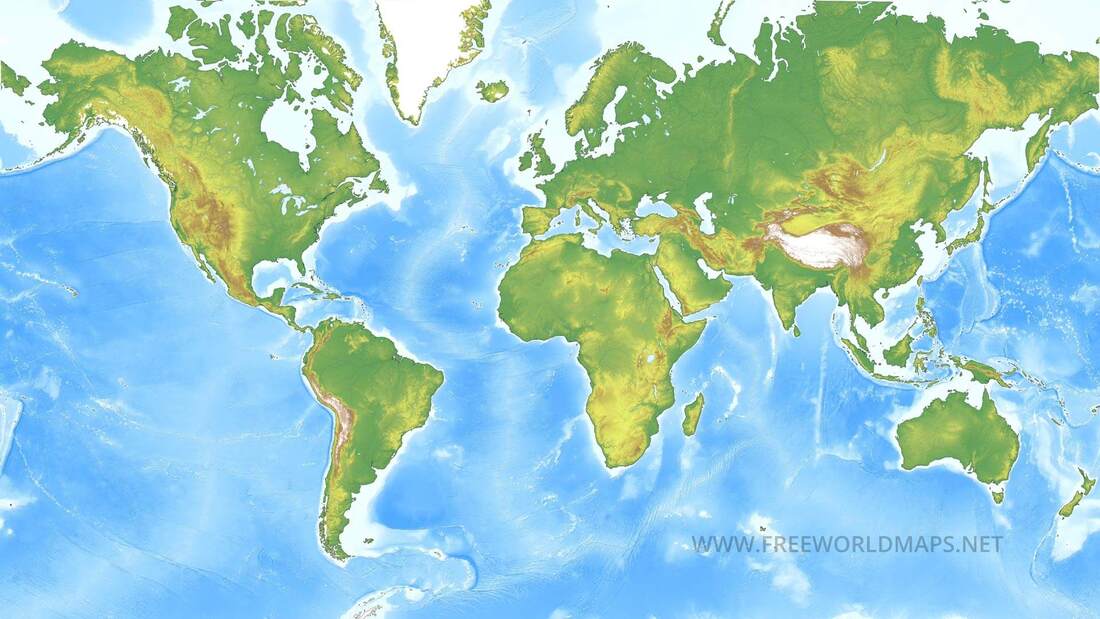
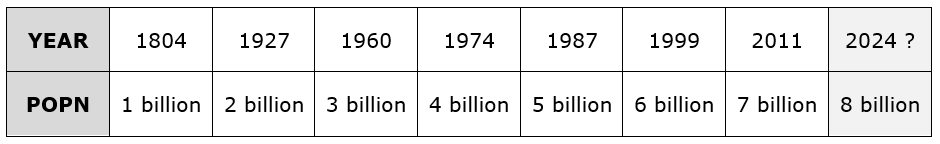
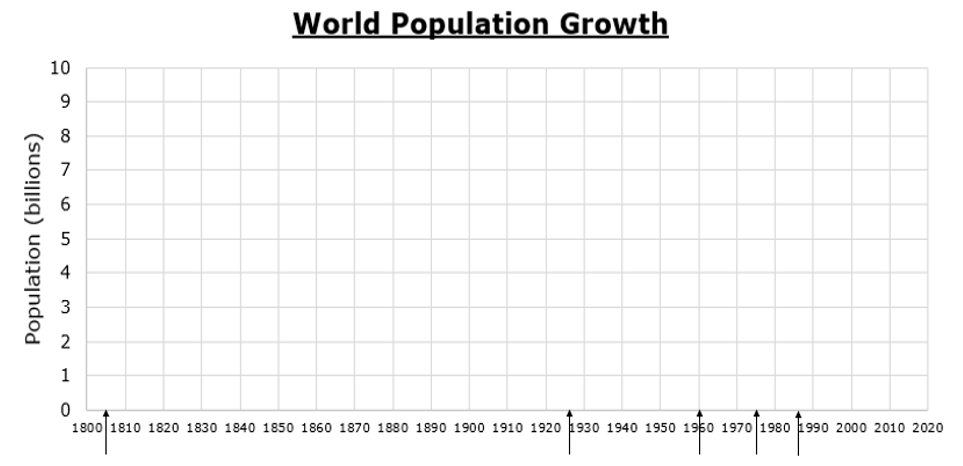
The map below can help to understand the distribution of the world’s population. It confirms how unevenly people are spread over the world. Vast areas have hardly any people living in them whilst other areas seem to be very crowded. Cities are very popular places in which to live. They can provide housing, jobs, education, medical care and a better chance of getting on and enjoying life. More than half the world’s population now live in cities and the number is increasing all the time. The population of the world is increasing very quickly. Experts have worked out that every hour there are an extra 8,000 people living on our planet! Looking at the population graph, you can see that the world’s population reached its first billion in 1804. By 1927, the population had doubled to 2 billion and it doubled again to 4 million by 1974. The world’s population has been increasing so fast that it is described as a population explosion. Until 100 or 200 years ago, population growth was actually very slow. Only in recent times has there been a real ‘explosion’. A major world problem is how to feed, clothe, house, educate, provide jobs and care for this rapidly increasing population. 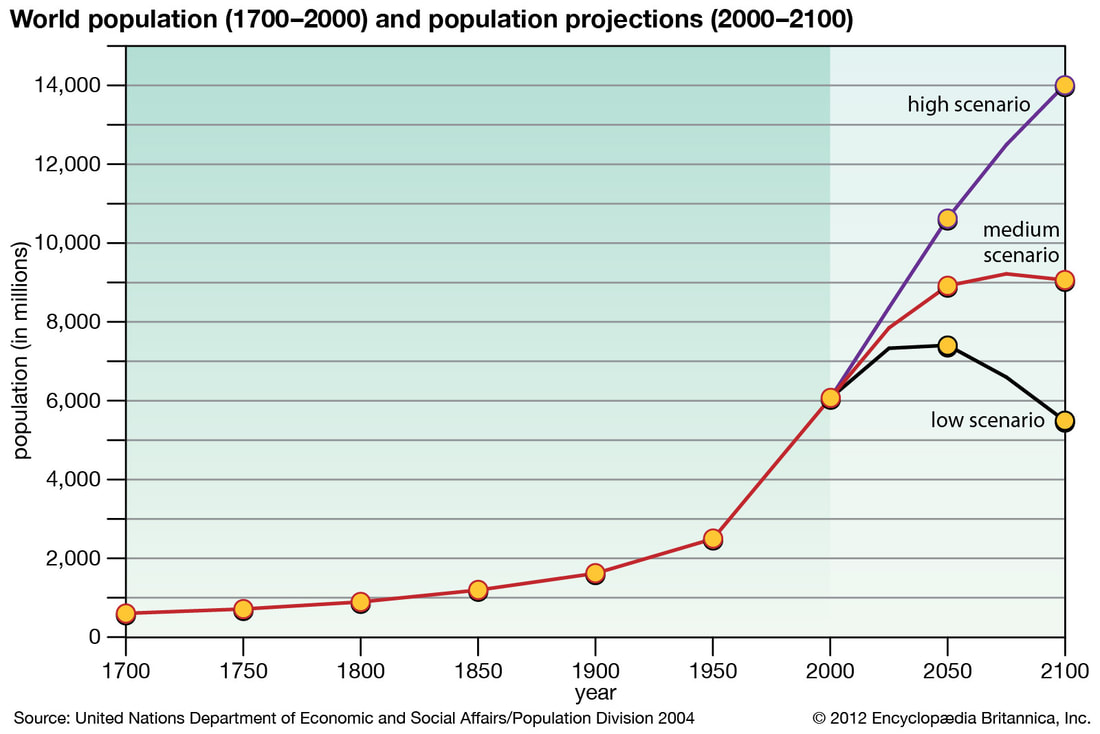
|
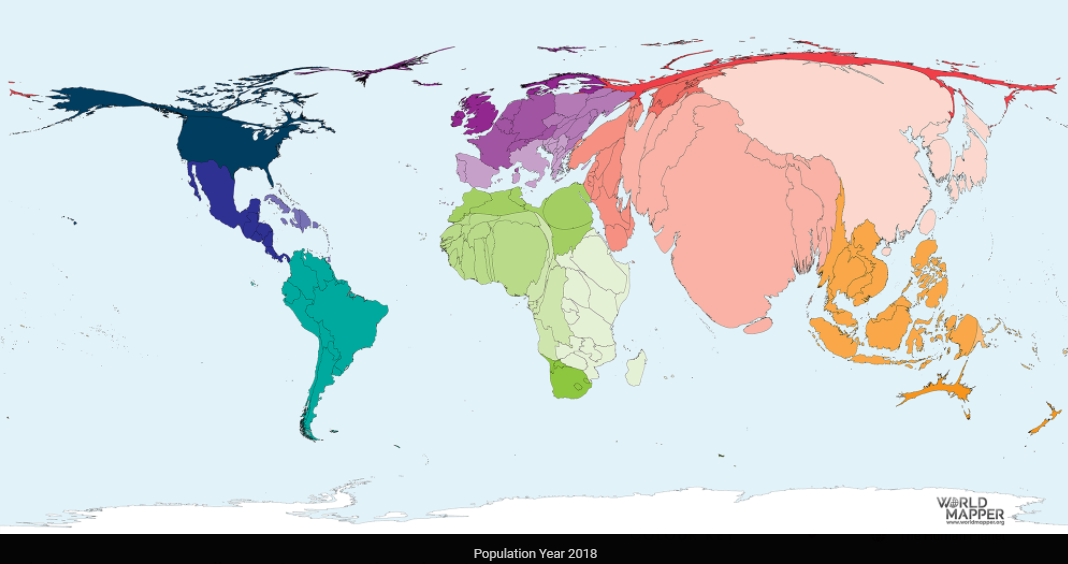
This map shows how the distribution of people looks like by resizing each country according to the total number of people.
You can click on the map to see other similar maps.
|
Geo-check!
|
1. The table here shows every year the world’s population reached the next billion.
a. Using the table, plot the points on the chart above. b. Draw a line to join the 7 markers. c. Describe the increase in world population. d. Why is ‘explosion’ a good description of population changes since 1950? 2. In general, where do more people tend to live? Give at least THREE reason for why this is true. (Finish the sentence) Most people live in the middle of continents OR on or near the coast. This is because... |
|
4. FASTEST GROWING CITIES
|
🡺 I can mention areas where the population is growing very fast.
Countries change and grow in different ways. We refer to a country that has a lot of money, many services and a high standard of living as a developed country. Malta, England, Germany, United States, Australia and Singapore are all developed countries. A country that is improving their economy, services and a standard of living is a developing country. Kenya, Sudan, Indonesia, Syria, India and Brazil are developing countries. 
|
|
Geo-check!
|
1. Name FOUR developing countries and FOUR developed countries.
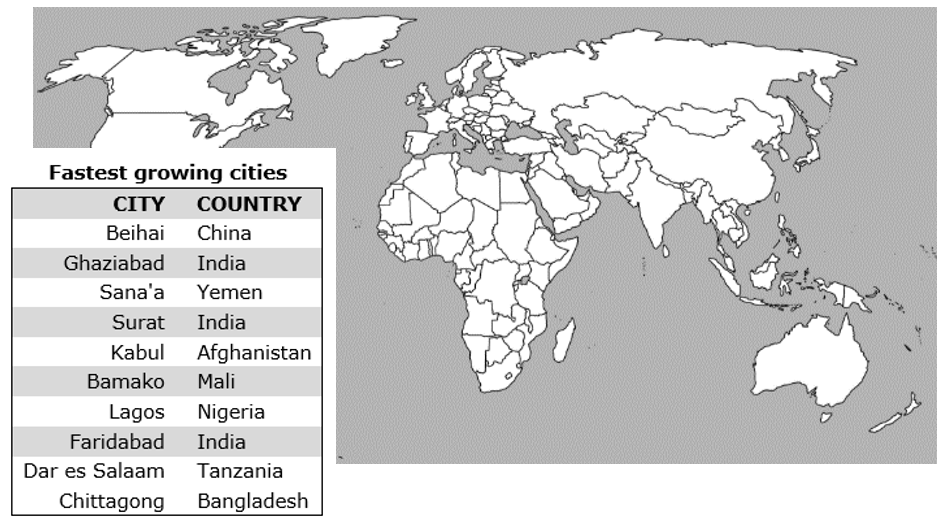
2. Here is a table showing some of the world’s fastest growing cities. Using a political map on your atlas: a. Colour in the countries listed in the table on the map below. b. Mark the cities on the map below. 3. Explain FOUR problems that a fast increase in population can cause. 4. Can you think of some benefits a fast-growing population will have? »» SOLVE IT! The city of Shanghai in China has 24.2 million people. It is estimated that by 2030, it will reach 30.8 million people.
|
|
5. POPULATION INCREASE AND DECREASE
|
🡺 I can define birth rate, death rate and growth rate.
🡺 I can explain why there is population changes in places. Population increases when the number of babies being born is greater that the number of people dying. The number of babies being born each year is called birth rate. The number of people who die each year is called the death rate. Birth and death rates are measured as the number of births and deaths for each 1,000 of the population. The speed at which the population increases is called the population growth rate.If there are more babies being born than people dying, the population increases. If there are more people dying than babies being born, the population decreases. If there is the same number of babies being born as people dying, the population remains steady. The population growth rate is not the same for all countries. In some, like Malta, the difference between birth and death rates is small so the population is changing only very slowly. In other countries, like Bangladesh, there are big difference between the birth and death rates, so the population is increasing rapidly. There are a number of factors that affect birth and death rates. Some of these are:
|

|
Geo-check!
|
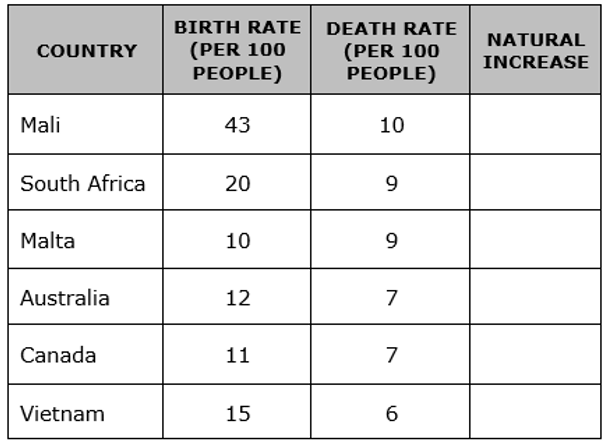
1. Match the following terms to their correct definitions.
a. Population explosion b. Birth rate c. Death rate d. Natural Increase e. Steady population ____ The number of deaths each year for every 1000 people ____ When the birth rate and death rate are equal ____ When the population increases at a very fast rat ____ The number of births each year for every 1000 people ____ Birth rate minus death rate 2. Study the table to the right showing the birth and death rates of six different countries. a. Fill in the column Natural Increase. b. List the countries by the size of the natural increase (The largest should go first). c. Using the information in the Natural Increase column, highlight the developing countries above. What do you notice about the developed and developing countries? |
|
3. Draw a cross shape next to those factors below which you think would increase the death rate. Draw a baby shape next to those factors which would increase the birth rate.
4. There are some unfinished sentences below. For each of the sentences, write down if the birth or death rate rises / falls / is not affected.
a. If everyone gets better food to eat, then birth rate ______________ and death rate ______________
b. If a terrible war breaks out, then birth rate ______________ and death rate ______________
c. If a deadly disease spreads, then birth rate ______________ and death rate ______________
d. If there is a severe famine, then birth rate ______________ and death rate ______________
e. If more hospitals and doctors are provided, then birth rate ______________ and death rate ______________
f. If more and more women get jobs, then birth rate ______________ and death rate ______________
g. If more girls are educated, then birth rate ______________ and death rate ______________
CHALLENGE!
In the future, what do you think will happen to the birth rate of Malta and Mali? Do you think they will increase, decrease of remain the same? Why?
- Dirty water
- Young age of marriage
- Not enough food
- Lots of disease
- Reliable food supply
- Children begin working when young
4. There are some unfinished sentences below. For each of the sentences, write down if the birth or death rate rises / falls / is not affected.
a. If everyone gets better food to eat, then birth rate ______________ and death rate ______________
b. If a terrible war breaks out, then birth rate ______________ and death rate ______________
c. If a deadly disease spreads, then birth rate ______________ and death rate ______________
d. If there is a severe famine, then birth rate ______________ and death rate ______________
e. If more hospitals and doctors are provided, then birth rate ______________ and death rate ______________
f. If more and more women get jobs, then birth rate ______________ and death rate ______________
g. If more girls are educated, then birth rate ______________ and death rate ______________
CHALLENGE!
In the future, what do you think will happen to the birth rate of Malta and Mali? Do you think they will increase, decrease of remain the same? Why?
|
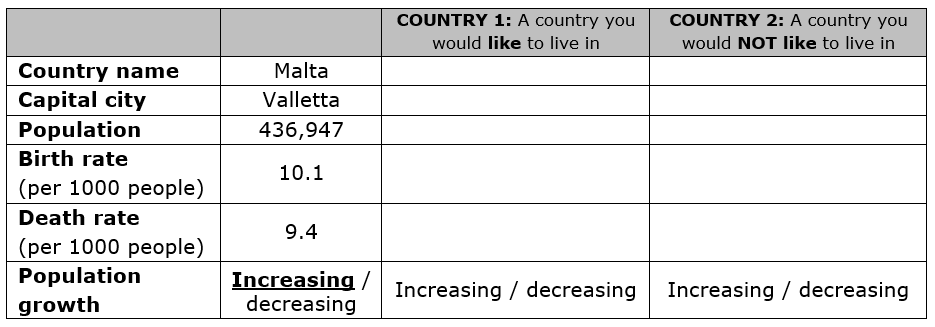
5. You will need access to the internet to do these questions. [Use this website: https://www.cia.gov/library/publications/the-world-factbook/]
a. Choose and write down any two countries. Then, using the World Factbook (People and Society section), fill in the table to the right. b. For Country 1, list and explain TWO advantages of living and TWO disadvantages of living here. c. For Country 2, list and explain TWO advantages of living and TWO disadvantages of living here. d. Think of the disadvantages of Country 2. Describe how they would make you feel if you lived there. |
|
